

The latest round of liquidations wiped out just under $800 million in leveraged positions. If there's one lesson to take away from this, it's that using leverage to buy the dip is a terrible idea.

Despite the fear and uncertainty gripping the market, Bitcoin's drop to $82,463 aligns perfectly with the 1.272 Fibonacci Extension level, marking a critical support zone. However, the real concern is the newly formed CME Gap at $78K, which could act as a magnet for further downside.

On-balance Volume has also broken support, indicating sustained selling pressure. While this is concerning, the long lower wicks on recent daily candles suggest strong buying interest at these levels. Bitcoin's weekly chart is in the process of printing a TBO Close Long ?, similar to signals seen in July and August 2024. Historically, this has led to extended consolidation rather than an immediate recovery.
Ethereum Struggles as Bearish Signals Continue

Ethereum is facing its own challenges, with daily RSI back in oversold territory. The 4-hour chart has printed two TBO Breakdowns, signaling potential continued downside. The ETH Apex chart has also fallen below its current support line, reinforcing the bearish outlook.
ETH/BTC remains weak, with a strong bearish TBO on both the daily and weekly time frames. While there were two recent TBT Bullish Divergence Clusters at support, the broader trend suggests that ETH is still struggling to gain traction.
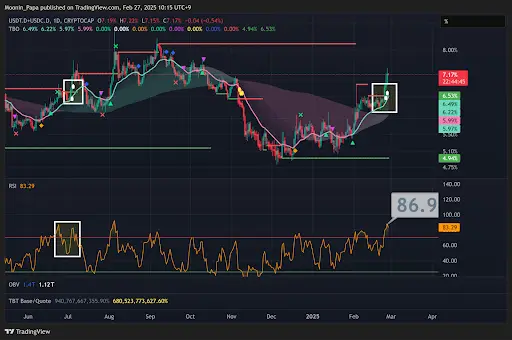
Stablecoin Dominance Hits 7.17% as BTC Dominance Falls

Stablecoin dominance printed another TBO Breakout on the daily chart, mirroring the pattern seen in July 2024. Back then, stablecoin dominance dropped by 16% after peaking, which could signal an eventual reversal in the current trend.

Bitcoin Dominance (BTC.D) unexpectedly dropped despite the broader sell-off, closing inside the daily TBO Cloud. This suggests that traders are beginning to reallocate capital into altcoins, rather than moving entirely into stablecoins or exiting the market.

Top 10 Dominance remains bearish but is showing early signs of stabilization with a bounce in daily RSI. OTHERS.D has also moved back inside the daily TBO Cloud, signaling a shift toward bullish consolidation.
Crypto Market Cap Reaches Critical Fibonacci Support
The TOTAL market cap chart made a new low on daily RSI, reaching levels not seen since

August 2024. A long-term Fibonacci extension from 2014 suggests that the market has reached an important support level. While it's still uncertain whether this level will hold, it provides a potential foundation for a recovery.

OTHERS market cap continues to show relative strength, closing higher despite the broader market turmoil. Daily RSI held above its previous low, and OBV has maintained support, signaling a potential shift in momentum. This suggests that mid- and low-cap altcoins may be leading the next phase of market recovery.

BVOL7D has surged 58% in just two days, confirming the extreme volatility in the market. However, RSI is already back in overbought territory, indicating that the worst of the panic selling may soon subside.
Traditional Markets and Gold Show Signs of Weakness

The VIX (Volatility Index) spiked above 20 this week, likely in response to renewed tariff concerns from Trump. However, daily RSI suggests that volatility may be cooling off, which could help stabilize the broader financial markets.

Gold experienced a significant pullback earlier this week, printing a TBT Bearish Divergence signal. Daily RSI continues to weaken, suggesting that gold may enter a bearish consolidation phase similar to what was seen in November 2024.
Oversold Altcoins Show Signs of Accumulation

Solana printed a third TBO Breakdown on the daily chart, typically a bearish continuation signal. However, when TBO Breakdowns appear after a significant sell-off, they can also mark reversal points. This was seen in November 2022 when SOL bottomed out before a strong recovery.

SHIB is worth watching, as it has printed two recent TBT Bullish Divergence Clusters along with hidden bullish divergence on RSI.

APT is testing its first resistance fan, with daily RSI trending higher and OBV signaling the start of a new uptrend. CRO is sitting at historical TBO Support from November 2024, making it an interesting level to watch.

WIF continues to look strong, while TIA has moved above overhead resistance and printed a TBO Close Short ? on yesterday’s candle. OP is showing bullish momentum, while POPCAT is attempting to reclaim the daily TBO Cloud.
Final Thoughts: A Market Reset Is Happening, But Altcoins Are Showing Strength
Bitcoin remains in a bearish trend, and the CME Gap at $78K remains a significant downside risk. However, long lower wicks on daily candles, hidden bullish divergence on RSI, and signs of strength in the OTHERS market cap chart suggest that the worst of the sell-off may be nearing an end.
While BTC and ETH struggle, altcoins—particularly mid- and low-cap projects—are showing early signs of accumulation. As the market stabilizes, traders should focus on identifying strong projects that are holding up well despite the volatility.
Patience remains key.
To master crypto investing and prepare for the next market phase, enroll in The Complete Cryptocurrency Investor at Mastering Assets.