

Bitcoin has now filled the $77K CME Gap, but the market remains heavily oversold and still deeply extended from the TBO Fast line on the daily time frame. Price is also well below the daily TBO Cloud, confirming that BTC remains strong bearish for now.
While CME Gaps frequently act as price-based targets, they do not serve as actual support levels. Instead, BTC’s next real support level sits at $73K. Given how far the price has already dropped, another $5K decline wouldn't be surprising before finding a more meaningful floor.

One of the key indicators to watch here is daily RSI, which is likely to move back into oversold territory below 25—but not as low as the 12.85 RSI low from earlier in this downtrend. This suggests that BTC is approaching, but has not yet reached, a bottom.
New TBO Breakdowns on the 4-Hour Chart

On the 4-hour time frame, BTC has new TBO Breakdowns in progress, a bearish continuation signal that historically precedes further downside. However, these recent Breakdowns are not the “three-in-a-row” variety, which would indicate a stronger trend reversal signal.

Additionally, the Stop-Loss Hunting Alert from last week correctly flagged this move in advance, helping to avoid a 10% drawdown in BTC alone. ETH, which typically moves with 1.2x to 2.0x BTC’s volatility, is currently down 18% from the same alert.
Ethereum Remains Strong Bearish on Every Time Frame

Ethereum’s price action continues to be one of the weakest in the market. While the contrarian argument for buying ETH at these deeply oversold levels is tempting, the reality is that ETH remains strong bearish on every time frame and has been for months.
The third TBO Breakdown on the daily chart is a sign that a bottom could be near—the last time this happened in August 2024, it marked the end of ETH’s previous downtrend.
However, the next major TBO Support level for ETH sits at $1,549, meaning further downside remains a real possibility.
Stablecoin Dominance Hits 8.21%, Nears Key Resistance

Stablecoin dominance peaked at 8.21%, just below long-term TBO Resistance at 8.22% and a previous resistance level at 8.09%. This suggests that we are at the top of a mid-term range.
While daily RSI is above 70, it has not exceeded the previous high of 86.95, indicating a weakening uptrend. However, the more concerning development is that weekly RSI is now above 70, which signals that stablecoin dominance is in a strong bullish trend and could continue climbing.
Bitcoin Dominance and Top 10 Dominance Reflect Uncertainty
Bitcoin Dominance (BTC.D) has pushed slightly higher, but the move lacks conviction. Meanwhile, Top 10 Dominance was sharply rejected back down to TBO Support at 11.82%, signaling that the largest-cap cryptos are struggling to hold up amid this sell-off.

The weekly Top 10 Dominance chart is now showing a TBO Close Long, which serves as an early warning of a potential bearish reversal. This aligns with the broader trend weakness across large-cap cryptos.
Meanwhile, OTHERS.D (mid- to low-cap alts) fell slightly yesterday, but not as dramatically as the Top 10 Dominance index, suggesting that smaller altcoins are holding up slightly better for now.
Crypto Market Cap Charts Show Worsening Conditions
The TOTAL crypto market cap chart has printed its second TBO Breakdown, reinforcing continued downside risk. TOTAL2 (altcoin market cap excluding BTC) is now working on its third Breakdown, increasing the likelihood of a deeper correction. TOTAL3 (altcoin market cap excluding BTC & ETH) printed its first TBO Breakdown yesterday, signaling that even alts that have outperformed recently are now at risk. OTHERS market cap is working on its third TBO Breakdown, and On-Balance Volume (OBV) has lost key support, a bearish sign that suggests sellers still have control.

The next major TBO Support levels for OTHERS sit at 192.15 and 172.95, meaning additional downside could be coming.
BVOL7D Still Holding Up, Indicating Volatility Persists

BVOL7D has yet to fall significantly, which makes sense given the continued volatility in BTC. Until BVOL7D starts dropping, it’s unlikely that altcoins will stage a sustainable recovery.
Key Altcoins at Support Zones

Solana (SOL) is sitting in a prime support zone, backed by multiple TBO Support levels, making it an attractive buy zone for long-term investors.

XRP has held up surprisingly well, but if it breaks below $1.77, it could enter a new bearish trend.

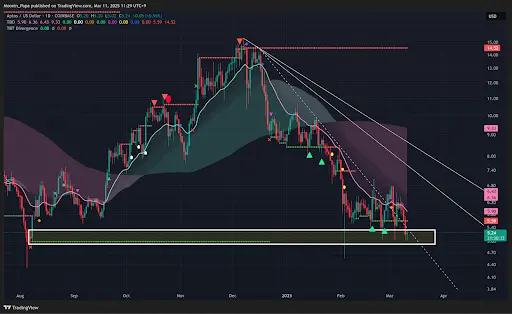
Aptos (APT) has shown strong support on every dip, with multiple lower wicks signaling demand at these levels.
Final Thoughts: Emotional Discipline and Long-Term Conviction
Markets like this test traders and investors not just financially, but emotionally. After years of experiencing bull and bear cycles, euphoria and panic, pumps and dumps, the biggest lesson remains the same:
Patience Pays.
For those looking to refine their investment approach and navigate these challenging conditions with confidence, The Complete Cryptocurrency Investor at Mastering Assets provides the essential tools and strategies needed to succeed.