

Bitcoin is currently trading in a calm but slightly weak state. Daily volume remains below the 30-day moving average, which is not a positive sign. Historically, when a market ranges sideways with declining volume, it often signals an eventual breakdown unless a bullish catalyst appears to provide momentum.
One potential positive development is that On-Balance Volume (OBV) is approaching a likely cross above its white moving average line. However, this alone will not trigger a major uptrend. Instead, OBV is likely to oscillate around the moving average until Bitcoin gains enough momentum to move decisively higher.

Confirming this outlook, BVOL7D has printed a TBO Close Long signal and has fallen below the Rejection Zone. This indicates that Bitcoin volatility is likely to remain low for the foreseeable future, which could be beneficial for altcoins and lower-cap assets.
Ethereum Remains Stagnant with No Clear Catalyst

Ethereum remains largely uneventful, moving in a tight sideways range much like Bitcoin. While daily RSI is slowly trending higher, it has yet to break through overhead resistance at 47. This resistance line has been in place since December and continues to limit ETH’s upside potential.
On-Balance Volume (OBV) is also showing no signs of improvement, continuing to move sideways while its moving average points downward. Without a clear bullish catalyst, Ethereum remains firmly in a bearish trend.
Stablecoin and Bitcoin Dominance Signal a Potential Market Shift

Stablecoin dominance is beginning to show bearish divergence between price action and daily RSI. While stablecoin dominance continues to trend higher, RSI has been making lower highs, signaling weakening momentum. Once stablecoin dominance falls into the daily TBO Cloud, it would indicate bearish consolidation—typically a bullish sign for Bitcoin and the broader crypto market.

Bitcoin dominance (BTC.D) remains in a sideways chop, but a TBO Cross Down signal is forming. While this signal alone does not guarantee a direction change, it reinforces the expectation that BTC.D may eventually drop inside the daily TBO Cloud. A decline in Bitcoin dominance would be a positive sign for altcoins, as it suggests BTC is being converted into alternative crypto assets.

The most promising dominance chart remains Top 10 Dominance, which is very close to breaking and holding above the daily TBO Cloud. This chart reflects the strength of top-tier altcoins like Solana, BNB, XRP, DOGE, ADA, and SHIB. The market appears to be favoring these assets, reinforcing a growing bullish trend.
OTHERS.D, representing mid- and low-cap altcoins, remains a key focus. Although price action has yet to react strongly, daily RSI continues to put in higher lows, building strength. A breakout above the long-term red resistance line is expected this week. However, a decisive move in favor of OTHERS will likely only occur once stablecoin dominance and BTC.D start to decline.
Total Market Cap Charts Show Strength Amid Volume Challenges

The TOTAL crypto market cap chart continues to look positive, with daily RSI moving higher and OBV recently crossing above its moving average. This is an encouraging step toward recovery, but the market still lacks sufficient volume to fuel a significant breakout.
TOTAL must push inside the daily TBO Cloud to confirm bullish consolidation. The next key resistance level to watch is 2.85T, with an upside target of 2.94T this week, as suggested by the weekly chart.

OTHERS’ market cap also presents an improving picture, with daily RSI breaking above a long-term resistance level for the first time since December 2024. Additionally, OBV has regained the yellow support line, indicating a return of buying pressure. However, without a substantial increase in volume, price action will remain sluggish.
Bitcoin Expected to Outperform Gold in the Coming Months

A critical development appeared on the PAXG/BTC chart, which represents gold priced in Bitcoin. A TBT Bearish Divergence Cluster has formed, suggesting that gold will likely underperform against BTC. The last time this signal appeared was in September 2023, after which PAXG/BTC fell nearly 60%, meaning Bitcoin outperformed gold significantly.

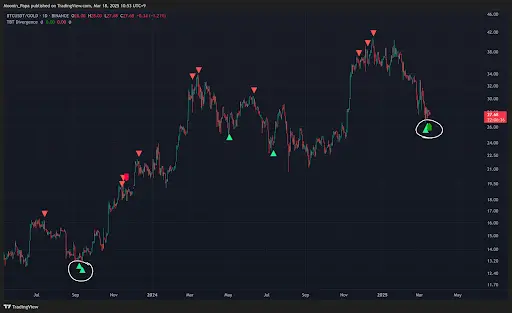
Flipping this analysis, when looking at BTCUSDT/XAUUSD, another TBT Divergence Cluster printed on yesterday’s daily candle. The last time this setup occurred, Bitcoin rallied 150% over the next 180 days.
This signals a potential shift where Bitcoin begins outperforming gold over the coming months. While this does not mean gold will crash, it suggests that BTC has significantly more upside potential compared to the traditionally stable metal.
Given that BTC remains massively oversold, and that several bullish reversal signals have emerged on its daily chart, this reinforces the expectation that BTC will push back above $100,000 in the coming months. However, this does not imply an immediate rally—rather, a gradual outperformance over time.
Gold, meanwhile, is likely to either chop sideways or slowly trend higher, as is typical for the asset. However, based on historical patterns, BTC is positioned to deliver stronger gains in the months ahead.
For those looking to refine their investment approach and navigate these market conditions with confidence, The Complete Cryptocurrency Investor at Mastering Assets provides the essential tools and strategies needed to succeed.