
…does it not stand to reason that “Everybody’s” selling Gold? After all, for every ounce bought, it must be sold to the buyer, non? ‘Tis merely the agreed-upon hitting of available bids and offers that makes the price change. But is such wise word to the Fin&Social/Media sufficient? Likely, no. Regardless, let’s go to Gold’s Moneyflow. Similar to the website’s MoneyFlow graphics for the S&P 500, below we’ve regressed Gold’s Moneyflow into points such that it can be directly compared with the actual change in price. To wit, this three panel display (one week, one month, one quarter) wherein the green line is the cumulative points difference between Gold’s price change and its MoneyFlow:

“So what’s with that big dip there, mmb? Because Gold is basically at a record high…”
Simple, Squire. Recall after Gold’s having settled at 3190 on 02 April came three robust rounds of selling, price then closing at 2999 on 07 April. The “big dip” — as you put it — merely indicates that the amount of money by points regression which flowed out of Gold hardly in full has flowed back in, even as price as risen to yet another All-Time High at 3372 this past Thursday, toward settling the abbreviated trading week at 3341. In fact, across the past nine trading days (07 – 17 April), Gold’s day-over-day contract volume declined for six of them, (see too our closing graphic).
“Well, none of THAT was on FinTV, mmb…”
Nor would it be, Squire, given their WestPalmBeacher audience. The point is: MoneyFlow ultimately leads price. And as you regular readers know, price at present remains technically well-extended above its BEGOS valuation line per this year-over-year graphic:

To be sure, “mis-valuation” — whether technical or fundamental — seems oft “forever” sustained in markets (a prime example being the S&P’s ongoing post-COVID extreme over-valuation). Obviously, one cannot “will” price to be elsewhere. For ’tis axiomatic that price itself net of its bids and offers is never wrong; Gold therefore by its weekly bars and parabolic trends from a year ago-to-date is ever right:

Gold’s All-Time Closing high was recorded this past Wednesday at 3358. ‘Twas but half that at 1679 a mere 2.3 years ago as encircled in the following table of Gold’s closing price “doublings” since 1975, which was the first full year featuring Gold futures at the COMEX:

‘Course per the table’s footnote, Gold first achieved the 1679 closing level some 14 years ago on 08 August 2011. That — for those of you scoring at home — means Gold was net “unch” after 11 years despite a harrowing route.
Veteran readers may remember back in 2011 our penning about price “having gotten ahead of itself”, after which Gold was severely sold — indeed way oversold — to as low as 1047 on 17 December 2015. ‘Twas exemplary of Gold’s trials and tribulations as it fell far behind the Dollar debasement curve, which is de facto the most acute tool to value the yellow metal per our opening Gold Scoreboard.
Fast-forward to today at 3341, Gold still is -13% below the Scoreboard’s value of 3833. Assuming that flexing level is graphically eclipsed (and we’re still around), we’ll again write of Gold “having gotten ahead of itself”. Certainly at present, the Gold hype is ripe with 4000 in sight … which likely means it shan’t get there anytime soon. Again given Gold’s expected yearly trading range — and assuming the 2625 low (06 January) holds — 3400 may well be Gold’s top for this year should “TT” (“Trump Tariffs“) reach some accord and Europe not be sucked into war.
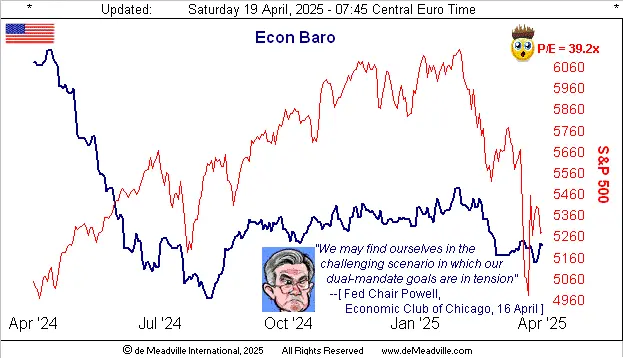
One wonders as well if the StateSide Economic Barometer has topped for the year. ‘Tis speculated that “TT” are grinding the economy to a halt: “You mean we gotta make our own stuff?? I just wanna stay at home with my phone!!” (You tell ’em, Stoopid).
Further, there’s still evidence of inflation, disinflation, stagflation and now even deflation, the latter per Labor’s March data. But wait, as we offer more confusion: last week’s set of 13 incoming metrics for the Econ Baro found six having improved period-over-period, six having worsened, and one as “unch”. Even those so-called six-figure “experts” are amiss: their consensus for April’s Philly Fed Index was +10.0 … it came in at -26.4 … “Ooooh!” Here’s the year-over-year view, wherein even “The Chair” perhaps is confused:

Note as well in the Baro our “live” Price/Earnings ratio for the S&P 500 is still a hair-raising 39.2x (summation of: current prices ÷ trailing 12-month earnings x capitalization weighting, wherein non-earners are assigned their price as P/E). The good news is that Q1 Earnings Season — whilst still early with just 41 S&P constituents having thus far reported — recorded 73% as having improved year-over-year results, which is an above average pace. The bad news is — as you’ve herein read a bazillion times — the overall level of earnings remains far too low to support price, the P/E ratio invariably reverting to its mean, especially given the S&P’s 1.462% yield versus the 4.205% annualized yield on risk-free 3-month U.S. Treasury Bills.
Far more broadly, if one can stomach the volatility, Gold also is risk-free. Simply stated, the higher the amount of fiat dough, the higher Gold shall go. Recall GEICO’s infamous quip: “It’s so easy, a caveman can do it” … and according to archaeology evidence, they were Gold-aware away back in the BCs.
What we next find is Gold’s notably having outperformed Silver of late via the two-panel display of daily bars from three months ago-to-date for the yellow metal on the left and for the white metal on the right. Last year from mid-May to mid-July, the Gold/Silver ratio basically resided in the 70s. Today ’tis 102.7x, Sister Silver having yet again been led lower by cajoling Cousin Copper. “For shame, young lady, for shame!”

Still, by their respective 10-day Market Profiles, Silver (below right) has managed to work higher, positioned therein quite similarly to that of Gold (below left). And our sense is that Gold’s dominant volume supporter at the denoted 3237 price surely shall be tested in the new week:

To close it out, as earlier noted, Gold on Thursday reached an All-Time High of 3372, (indeed already +110 points above our year’s forecasted high of 3262). Our being curious to see the FinMedia’s acknowledging of the fresh All-Time High, we went to three key website main pages: Bloomy – no mention; Dow Jones Newswires: – no mention; CNBS – no mention.
Thus: do pardon our forgetting that — at the end of the day — Gold remains an inert relic. Or as ’tis said, “Nothing to see here” in this year-to-date chart of Gold, given every ounce bought must also be sold, (the “receding” volume, behold, per our MoneyFlow all told):

So, should Gold duly near-term flop, one ought fear not. Rather: be prepared to buy the drop!
Cheers!