
Bitcoin Clears Key Highs With Momentum, But Resistance Looms
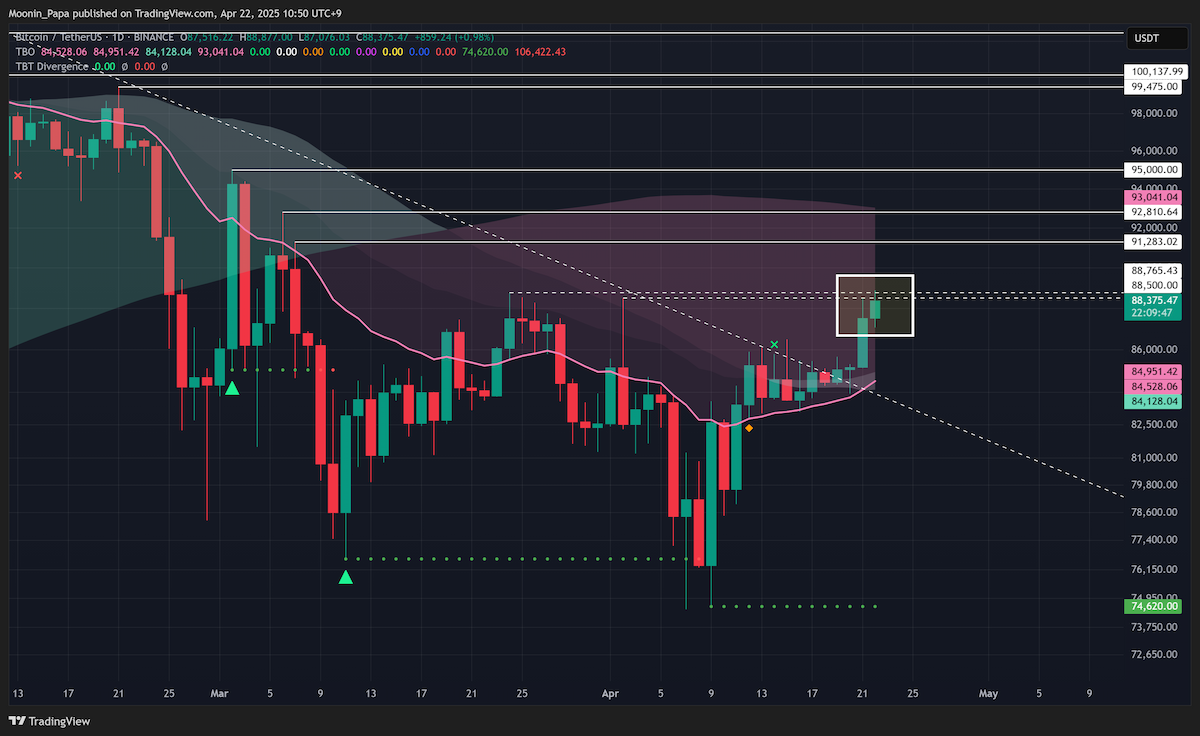
Bitcoin surged above $88,500, piercing its previous local highs and signaling a fresh wave of bullish continuation. This breakout triggered nearly $100 million in BTC short liquidations and over $130 million across the broader crypto market. The move also validates the recent bullish structure inside the daily TBO Cloud, putting BTC firmly in consolidation mode with strong upward momentum.
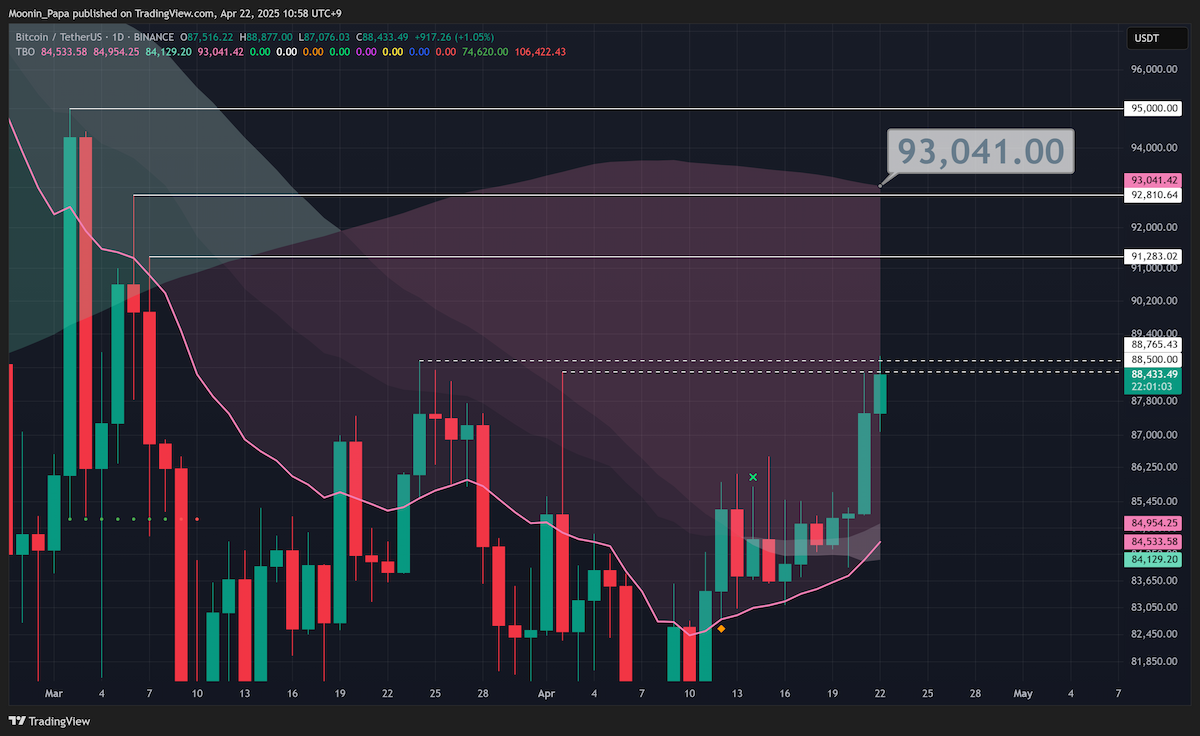
The short-term outlook is encouraging. Bitcoin has two upper resistance ray targets ahead—just over $91,000 and just below $93,000—with the top of the TBO Cloud aligning just above $93,000. All of this sets the stage for a run to $94,000–$95,000 within days. That price target has been in focus for weeks, and now technicals are lining up with the long-discussed Fibonacci retracement cluster between $94,500 and $95,000. These levels represent a confluence of the 0.618 Fib retracement from the current trend and the 1.618 extension from 2024—making them a textbook zone for resistance.

Psychology and Pattern Recognition Suggest a Pullback Is Imminent
The rapid rally and clearing of local highs have shifted the crypto market's mood from fear into disbelief. As BTC climbs closer to $95,000, expect frothy sentiment to return with calls for $250,000 and beyond. But technical and psychological patterns suggest a likely pullback from that zone. If BTC begins to stall near $95,000—evidenced by small daily candles and declining momentum—traders should anticipate a retrace to around $82,000.
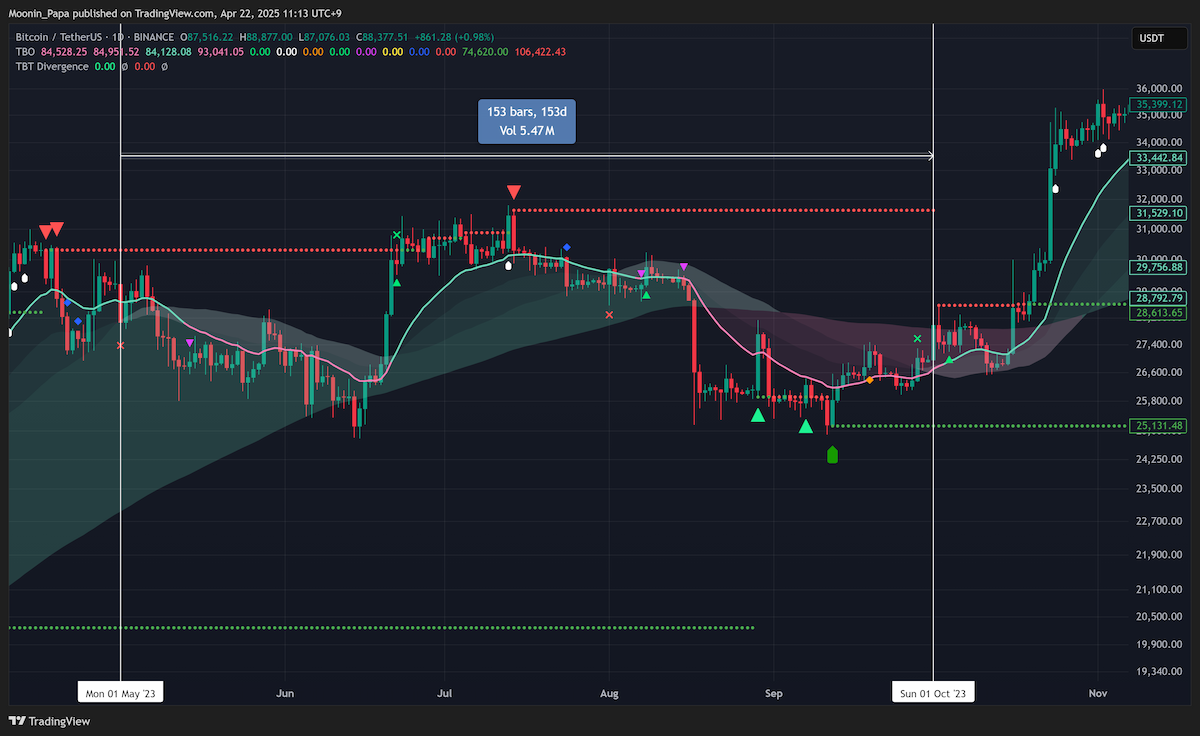
The market has followed similar behavior before. In late 2024, BTC chopped sideways from April to October before finally breaking out. The expectation of a repeat isn’t just based on patterns, but also seasonality. The old TradFi adage, “Sell in May and walk away,” has held true for BTC in multiple past years. In both 2021 and 2023, selling in May spared traders from extended periods of sideways chop. While nothing is guaranteed, it's a historically strong reason to approach May with caution.
Stablecoin Dominance Begins to Decline—A Bullish Signal
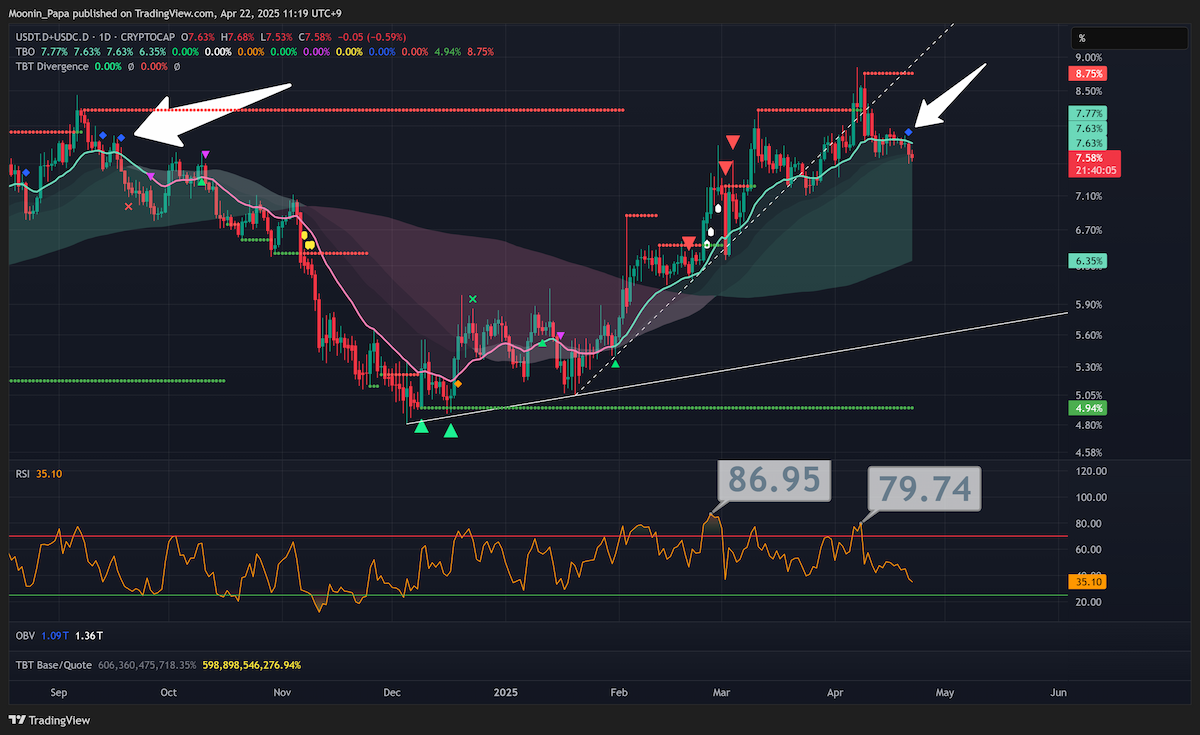
A TBO Close Long printed on the stablecoin dominance chart, just as it did before a major downtrend in September 2024. This is a key early signal that capital is rotating out of stablecoins and into crypto assets. While it may take weeks for a full trend shift to play out, this signal is typically a precursor to market-wide bullish activity. Traders should remain "expectant" rather than euphoric, as this rotation will be gradual.
Bitcoin Dominance Signals Outperformance Ahead
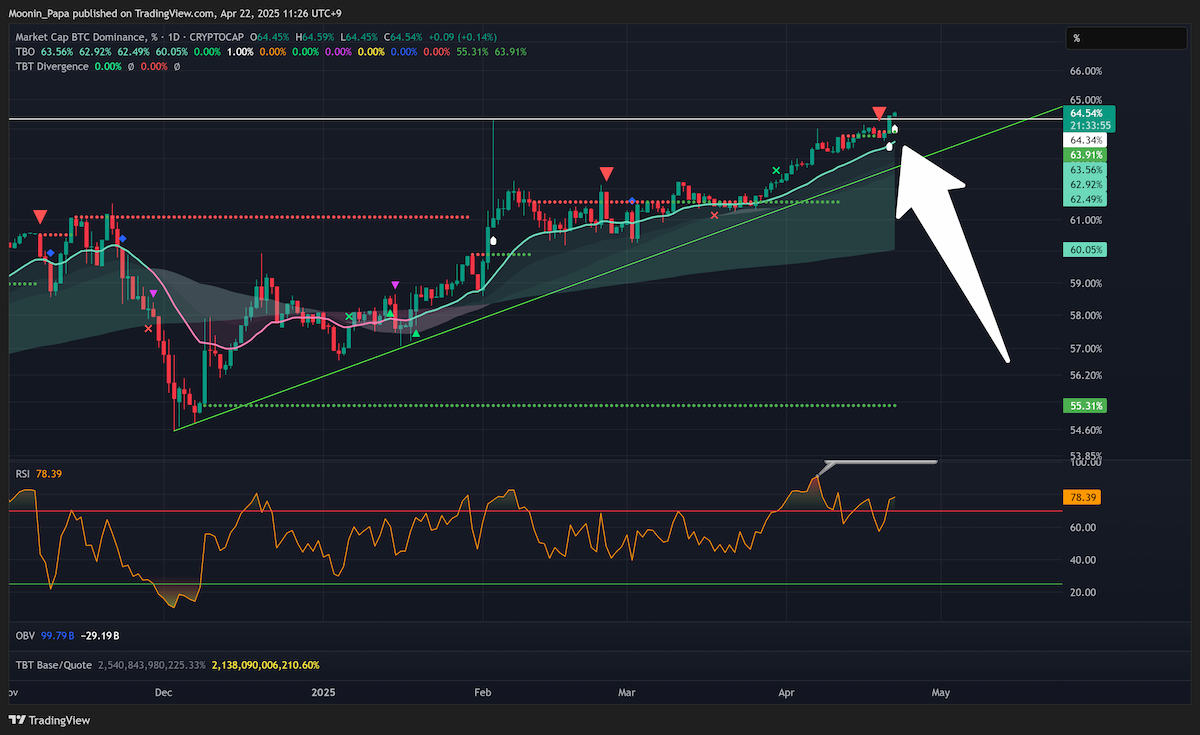
Bitcoin dominance closed above its February high of 64.34% and printed a TBO Breakout, indicating strong market preference for BTC over altcoins. Weekly RSI has pushed past its October 2024 high, now sitting well above 80—an extremely bullish reading across all timeframes. This dominance shift means that BTC will likely continue leading the market, with ALTs struggling to keep up.
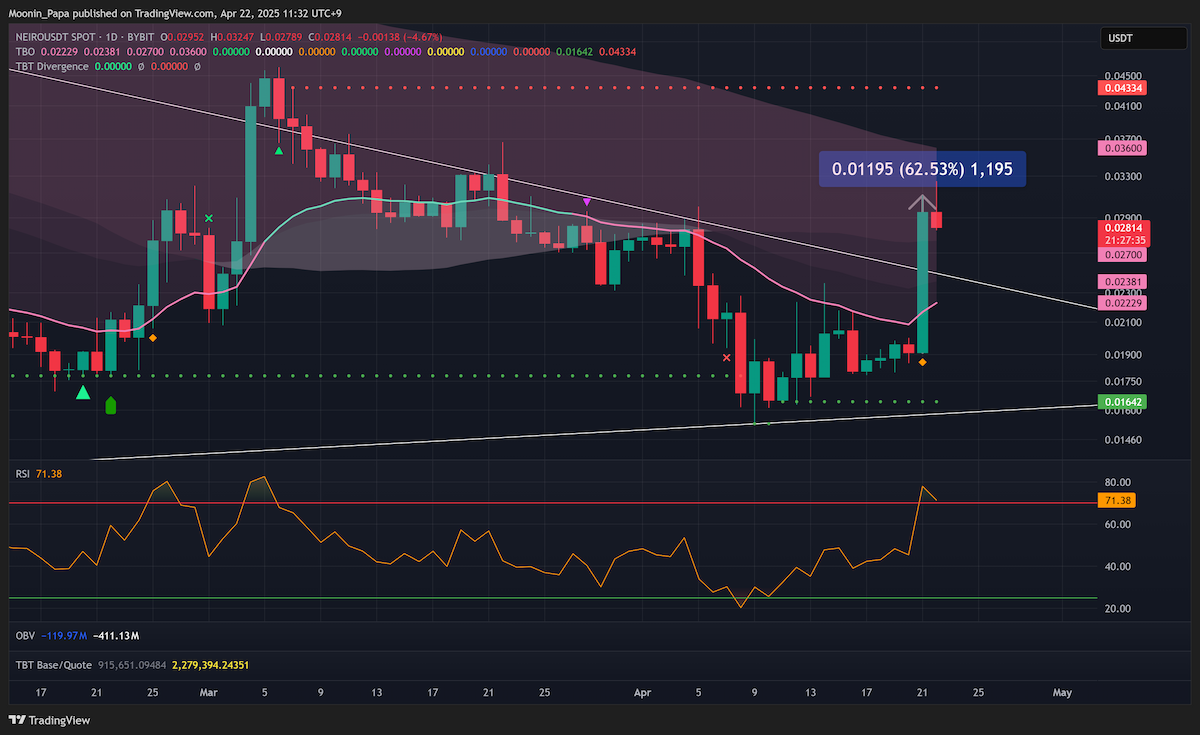
While there will be exceptions—like NEIRO on Ethereum, which surged 60% unexpectedly—most altcoins remain deeply oversold. Red closes across both Top 10 Dominance and OTHERS.D confirm this lagging behavior. With capital rotating into BTC and away from other assets, the current structure supports further BTC-led rallies, not broad-based altcoin recoveries.
Why Bitcoin Still Rules the Market Cycle
There’s a reason Bitcoin is the foundation of every market update. While altcoins offer exciting short-term trades, BTC sets the tone for the entire market. When BTC breaks out, low-cap coins explode. But when BTC stalls or pulls back, low-caps collapse even harder. That’s why a minimum 30% BTC allocation is not just conservative—it’s strategic.
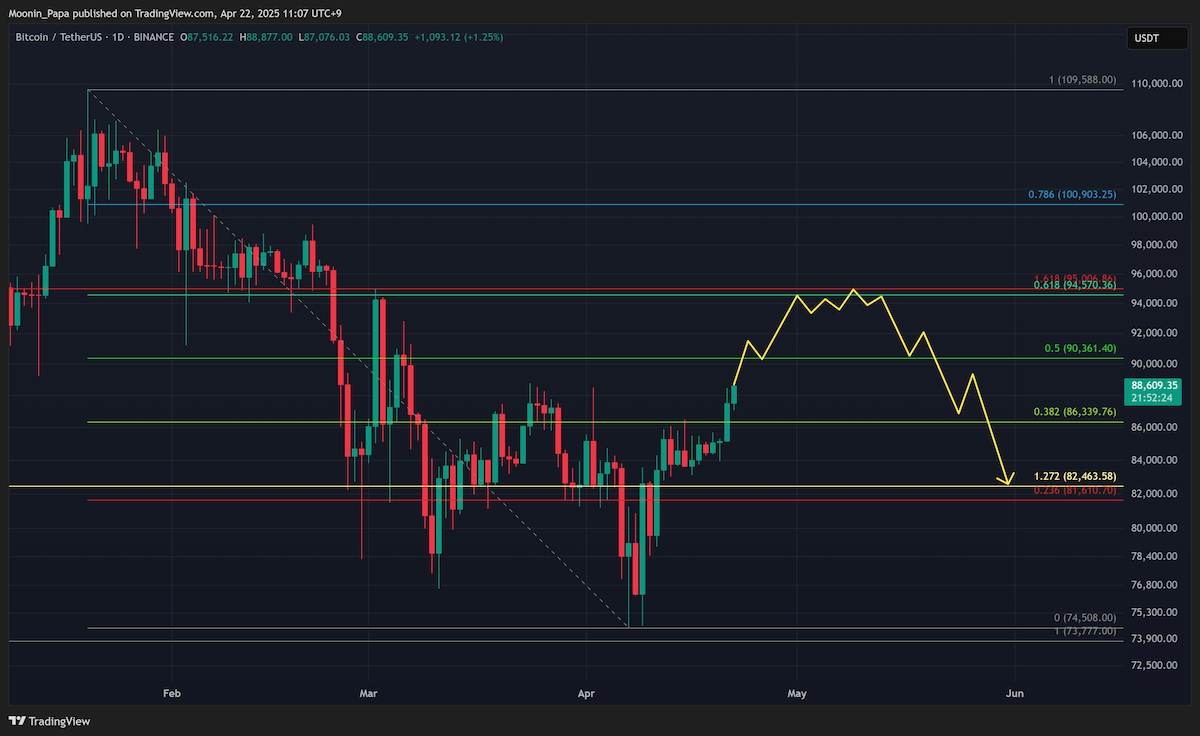
As the market pushes closer to $95,000, a pullback to $82,000 becomes a more realistic outcome. This wouldn’t be bearish, but part of a healthy market cycle before resuming a longer-term uptrend. If that pullback materializes in May, expect a summer of consolidation with a potential push toward $173,000 into the final quarter of the year.
For now, watch BTC closely. Don't ignore the signs of euphoria near $95,000. Stay flexible, take profits when appropriate, and protect your portfolio before the next major shift.
For a deeper understanding of how to navigate markets like these, start with The Complete Cryptocurrency Investor at Mastering Assets.