

Gold concluded the week with minimal activity, as the most active June futures contract settled at $3,247.40, down a mere $0.90 or 0.03% on Friday. This subdued performance follows three consecutive days of notable declines after Monday's $24 gain. The precious metal retreated $27.20 on Tuesday, $28.40 on Wednesday, and $50.90 on Thursday.
The three-day downtrend pulled June gold from Tuesday's opening price of $3,354.90 to Thursday's closing price of $3,248.30, resulting in a cumulative decline of $106.60. For a week where gold dropped $82.80 overall, Friday's fractional change represents a remarkably muted conclusion.
This week's price movement came amid significant economic reports and market developments. On Friday, the U.S. Bureau of Labor Statistics reported that nonfarm payrolls increased by 177,000 jobs in April, surpassing the consensus estimate of 133,000 positions according to MarketWatch. This figure represents a slight decrease from March's revised 185,000 jobs.
The employment data arrives as U.S.-China trade negotiations show signs of potential progress. China recently indicated it is considering a U.S. proposal for trade talks, though it seeks reductions in the 145% tariff imposed by the Trump Administration on Chinese imports last month as a precondition for negotiations.
This development marks the first indication that the world's two largest economies might take steps toward resolving their trade dispute, which has unsettled global markets. The news was particularly well received in Europe, where stock markets broadly strengthened on Friday as investors shifted toward risk assets.
U.S. equity markets recorded impressive gains for the week. The Dow Jones Industrial Average advanced 1,200 points or 2.99%, closing at 41,317.43. The NASDAQ Composite climbed 3.39%, finishing at 20,087.4, while the S&P 500 rose 2.92%, ending at 5,686.66.
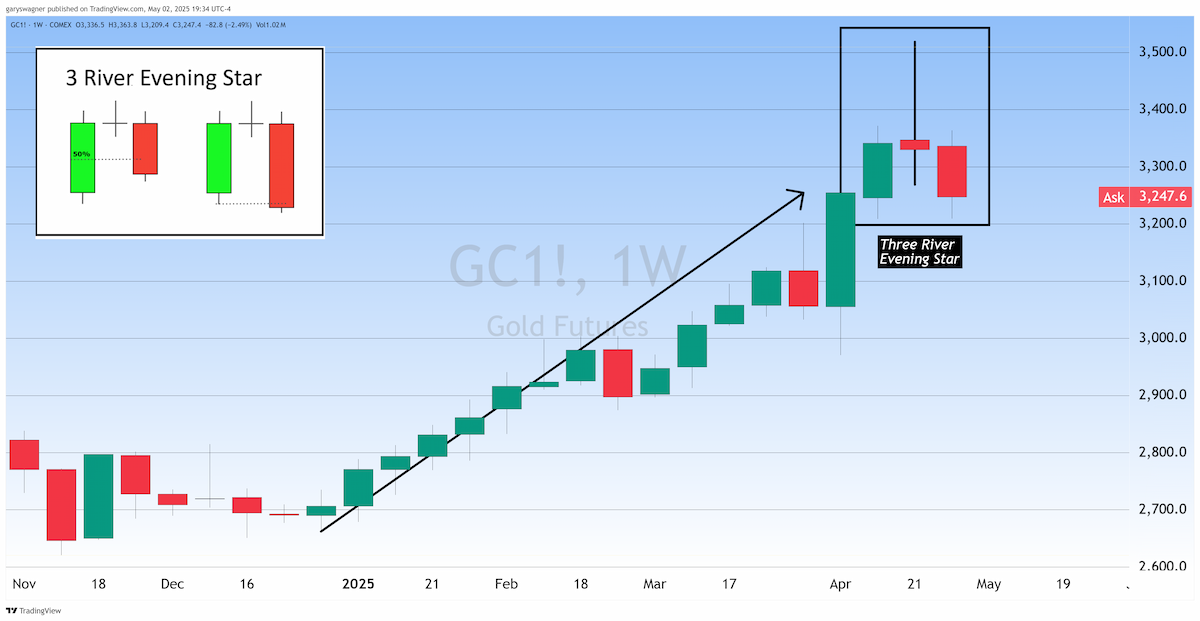
Technical Analysis Points to Potential Correction
Gold's recent price action has created a notable technical pattern on the weekly chart. During the week beginning April 21, June gold opened at $3,347 and closed at $3,330.20, resulting in a modest decline of $16.80. This created a candlestick type called a “doji,". It is created when you have a nearly identical opening and closing price.
The doji' significance becomes apparent when viewed in context with surrounding price action. The week of April 14 saw gold gain $86.40, forming a substantial green candlestick. This was followed by last week's doji and this week's significant decline, producing a large red candle.
Collectively, these three trading weeks have formed what technicians call a "Three River Evening Star" pattern. This bearish reversal formation typically appears after a defined uptrend and consists of a large green candle, followed by a "star" (either a small spinning top or a doji), which is then followed by a large red candle with its body below the doji' body.
For complete confirmation, this pattern requires a fourth candle: another large red candle with lower low, lower high, and lower body than the previous red candle. Should gold trade lower next week, creating such a formation, it could signal the beginning of a deeper correction in the precious metal's price.
For those who want additional information on our premium service, Click Here,
Wishing you, as always, good trading,