


BTC remains strong bullish but shows signs of compression
Bitcoin is still trading above the daily TBO Cloud and holding the $95,000 level despite a weak weekend pullback. The current structure remains bullish across the 4h, daily, and weekly timeframes, with RSI holding above 70 for ten days and the TBO Fast line pushing higher. However, BTC remains below several overlapping Fibonacci resistance levels and is yet to fill a nearby CME Gap around $96K. Volume remains below its moving average, and OBV is stalling—indicating a potential buildup before a bigger move.
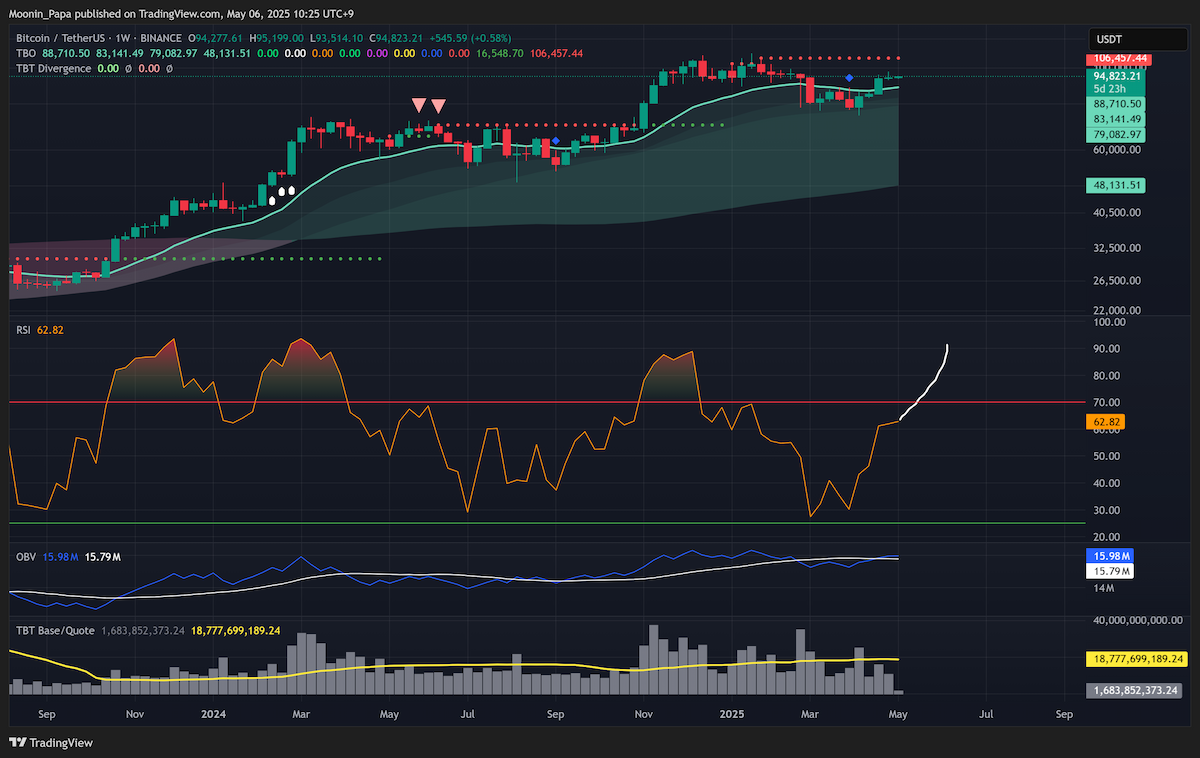
On the weekly chart, RSI is pushing higher and approaching 70. Historically, weekly RSI closes above 70 have preceded multi-week bullish trends. This reinforces the possibility of BTC moving past $97K and targeting $100K, then $103K (1.272 Fib Extension), and beyond.

Volatility indicators flash warning for a breakout

BVOL7D is showing concerning signs of falling volatility, with two consecutive TBO Breakdowns in progress. Historically, this kind of compression has preceded explosive price action in either direction.

Past examples from August 2023 and January 2023 show this behavior followed by major market moves.

Applying the same logic, BTC’s current posture above the daily TBO Cloud suggests a high likelihood of another upward breakout if this pattern repeats.
Dominance trends and macro flows support continued BTC leadership
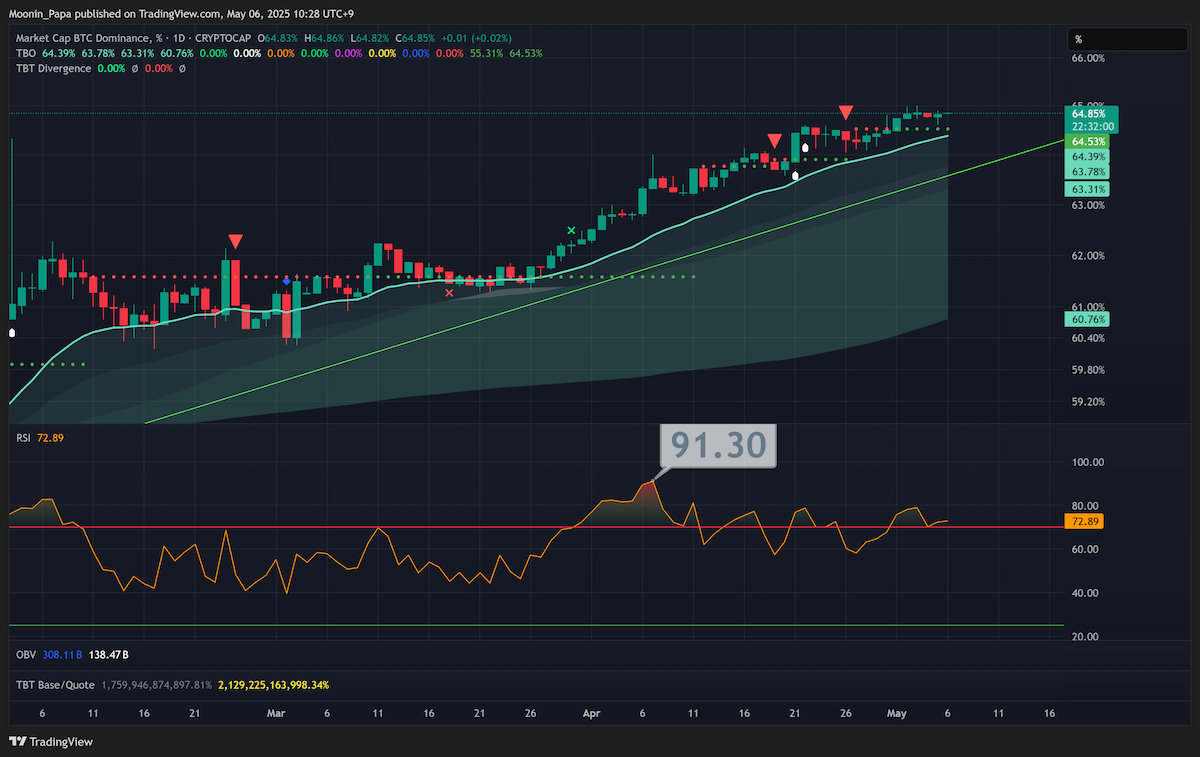
Stablecoin Dominance remains stuck inside the daily TBO Cloud, confirming bearish consolidation and indicating capital is rotating into risk assets. BTC Dominance (BTC.D) remains strong bullish on all major timeframes, while Top 10 Dominance is showing early signs of a bounce with bullish divergence on the 4h chart. Unfortunately, OTHERS.D continues to look weak, unable to reclaim its resistance level.
TOTAL is consolidating above its TBO Fast line, and the OTHERS market cap continues to stall under long-term resistance, with OBV nearly crossing below its moving average. Altcoin sentiment remains cautious.
Altcoins remain mostly weak, with scattered bullish setups
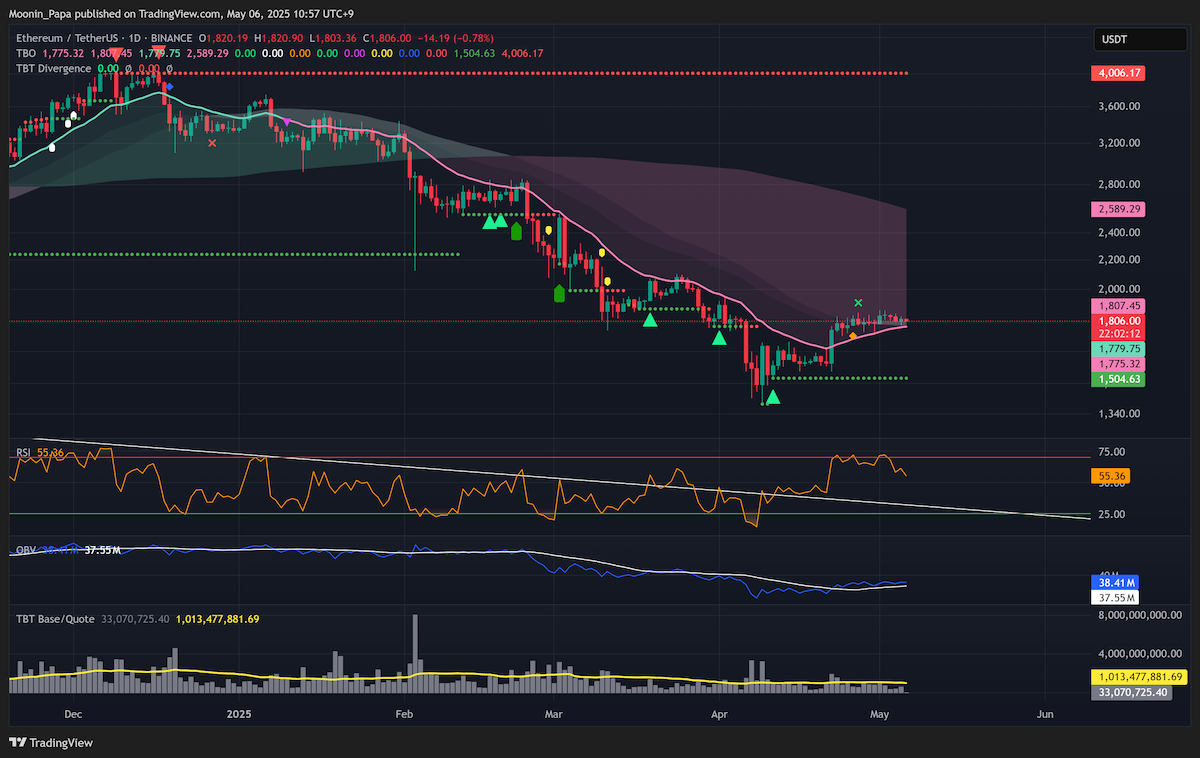
ETH remains flat, lacking both momentum and volume. XRP has fallen back into strong bearish mode, while BNB and SOL are both still struggling with overhead resistance. However, SOL’s 4h chart shows two TBO Close Shorts above support—similar to a past bounce setup. TRX continues to show strength as a bear market hedge.
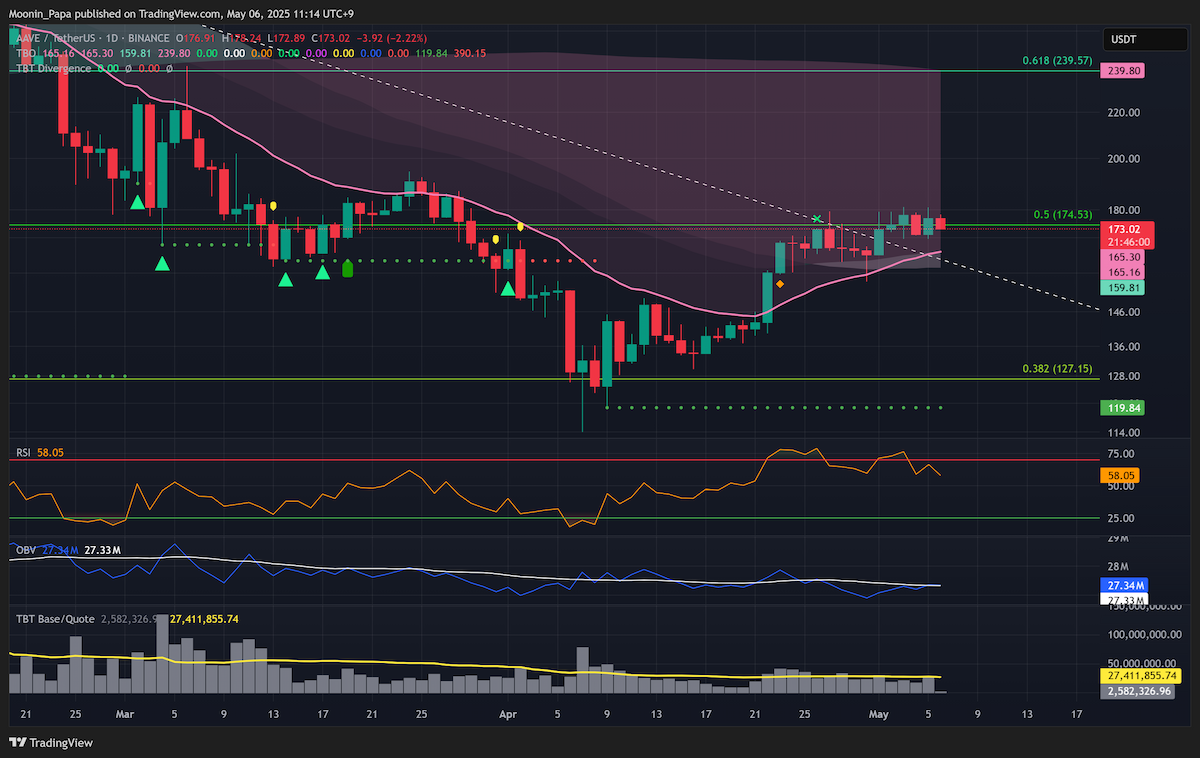
LINK, SHIB, and LTC are all struggling with declining RSI and OBV trends. OM is in a high-risk zone, printing a TBO Breakdown. ONDO also confirmed a bearish reversal. AAVE and TAO are showing some strength but still face key resistance. TIA and BERA are candidates for potential RSI Resets. DEXE and XCN are flashing reversal warnings via Close Shorts.
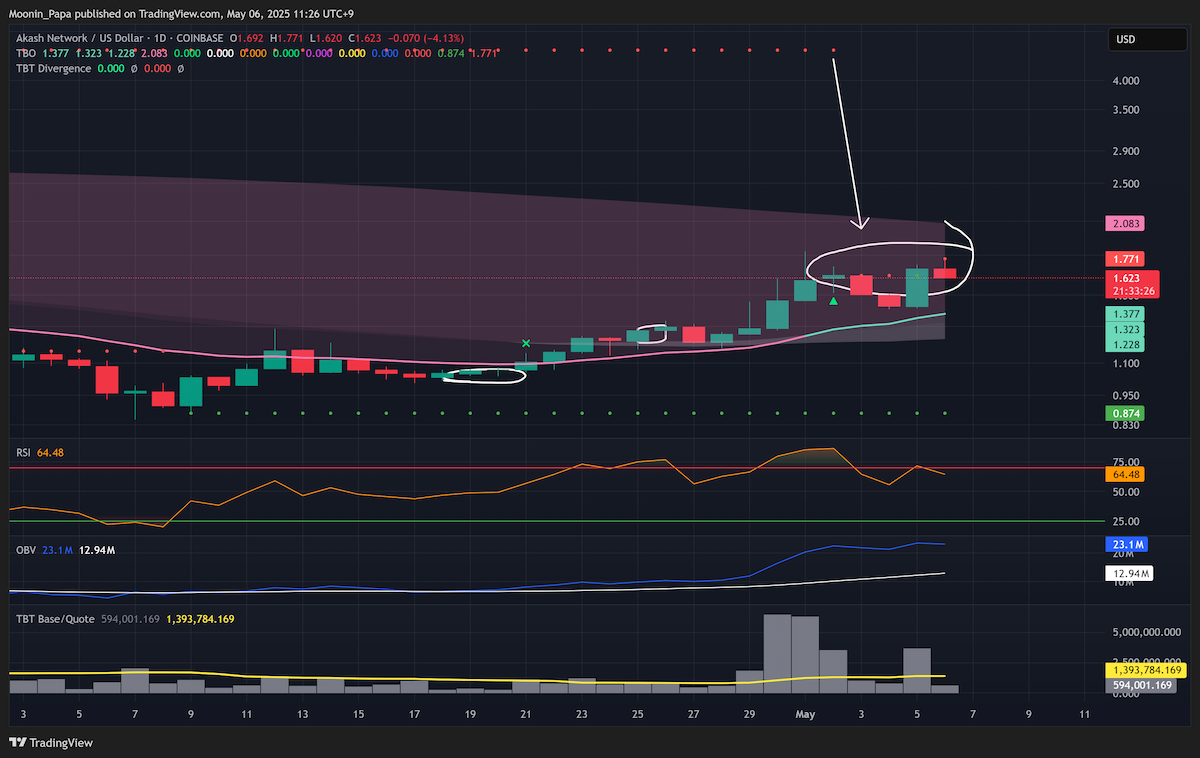
HNT, AKT, and GIGA illustrate the importance of watching TBO Resistance behavior—AKT’s resistance falling signals strength, but failure to close above key levels remains a concern.
Conclusion
BTC continues to show strength above $95K with support from the TBO structure and RSI. However, fading volume and a stalling OBV suggest we could be in the calm before a breakout—likely upward, based on historical TBO and volatility patterns. Altcoins remain mixed, with a few setting up for reversals and others struggling to gain traction. Keep watching the $97K-$100K zone closely for the next major reaction.
For in-depth strategy and tools, visit The Complete Cryptocurrency Investor by Mastering Assets.