

Gold futures basis the most active June 2025 contract has been able to maintain its pricing above a key level of technical support at $3180. After falling to a low of $317o on Wednesday, May 14 gold futures have been able to open and close above that key critical technical support level.
Technical support at $3180 is based on a market or price top that was created on Wednesday, April 2nd and April 3rd when gold prices closed at $3190 and then open him day at $3196. Gold would trade lower for two more days until finding support on Monday, April 7th, the final day of a price correction that preceded a 10 day rally concluding at the all-time record high above $3500 per ounce.
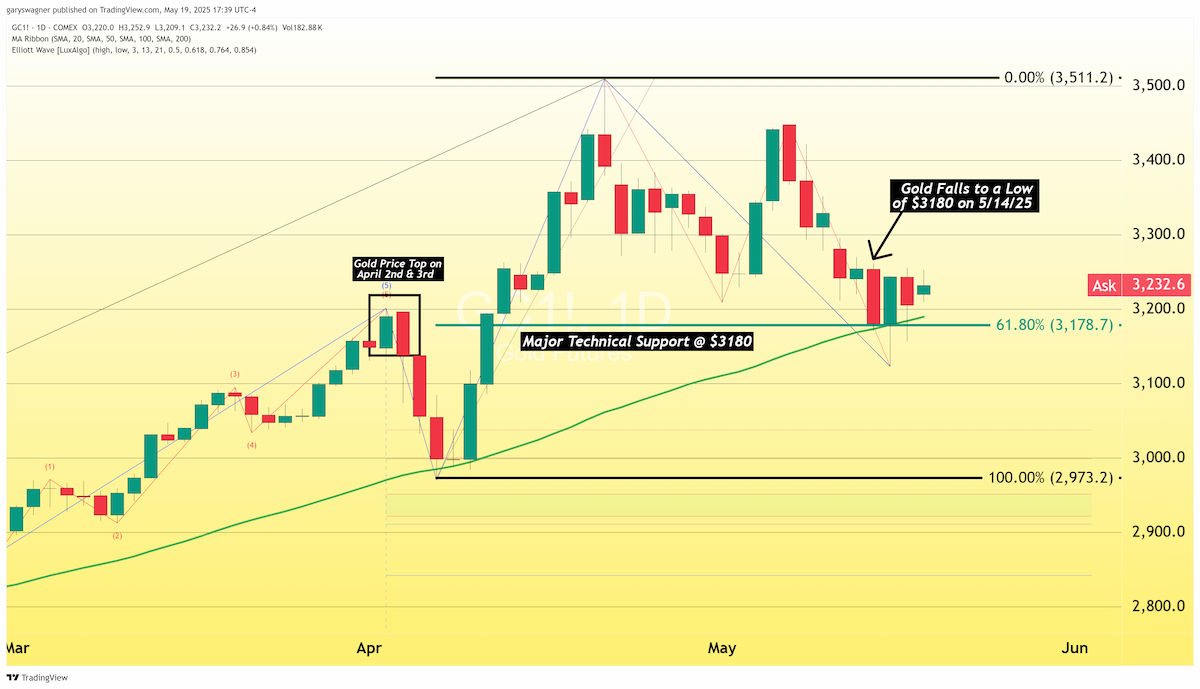
Over the next month gold pricing became range bound with values between a high of $3400 and a low of $3180. Additionally, $3180 defines a 61.8% Fibonacci retracement from the last major leg of a rally in gold as seen in the chart above.
Over the last four trading days gold futures pricing prices have consistently opened and closed above $3180 defining the current level of technical support.
The chart above is also a daily chart of gold future’s 2025 contract month. In addition to the Fibonacci retracement, below is a stochastic oscillator. The stochastic oscillator is a momentum indicator which market technicians used to identify whether a stock or commodity is overbought or oversold based on its current pricing relative to recent highs and lows. The stochastic oscillator is made up of two lines labeled the %K and the %D.
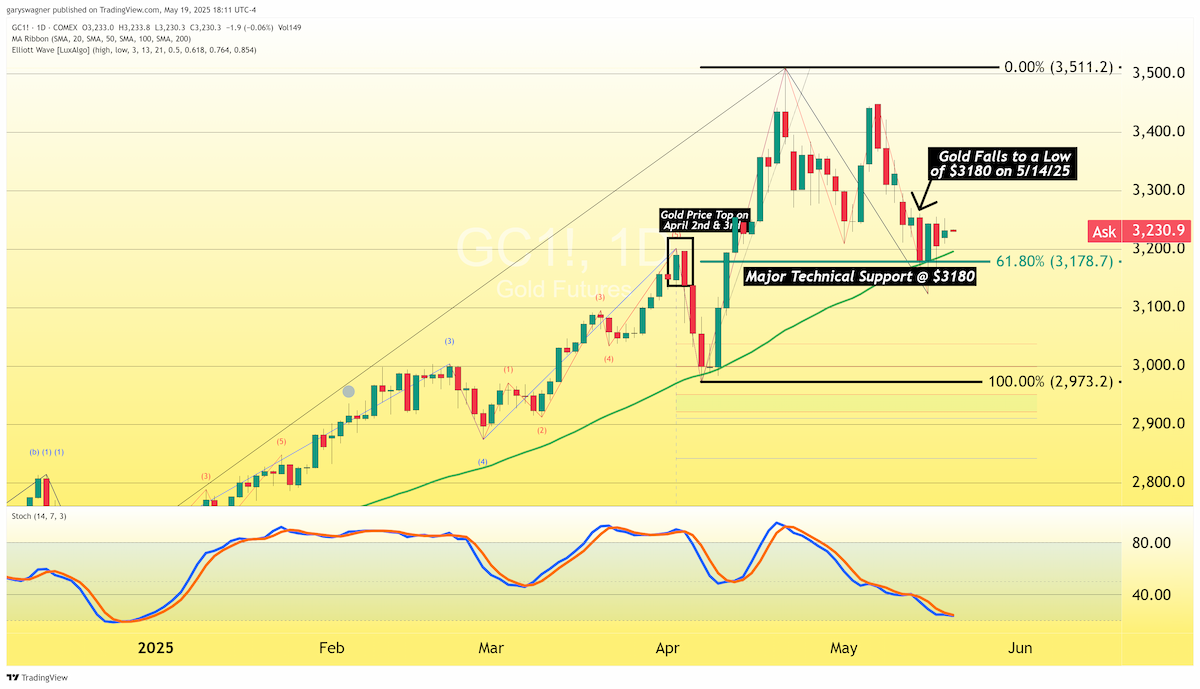
The %K line represents the current closing price as a percentage of the securities price range over a specific number of days, whereas the %D line is a moving average of the percentage K line. Readings below 20 are considered oversold, indicating that gold prices may be undervalued and could rally from this current price point. Currently it appears as though the percent K line which is drawn in blue is about to cross above the percent D line which is an indication that gold prices will in fact move higher from this price point.
Gold prices have found a technical level of price support at $3180 and over the last four trading days both the open and closing price have remained above this key level of technical support. As of 5:50 PM ET June gold has gained $26.90, a rise of +0.84% and fixed at $3232.20. It is also inside trading day in which the opening and closing price today are within the opening and closing price of Friday’s price range. Based on the fact that gold has shown resilience at the current support level of $3180 and the fundamental backdrop which has resulted in gold prices finding support which are the tariffs imposed by the current administration it is likely that gold will continue to find support at this price point and trade higher. That being said pending resolutions in numerous tariff battles between the United States and other world players such as China has given commodity futures as a whole the underlying fundamentals to move higher.
According to Benjamin Hoff of Societe Generale, "Risk appears to be back on, but trade and policy uncertainty remain incredibly elevated, and the clock is ticking on the 90-day relief on tariffs - due to expire in early August,"
For those who wish to learn more about our service, please go to the links below:
Information, Track Record, Trading system, Testimonials, Free trial
Wishing you as always good trading,