

TBT Stop Loss Hunting Alert and Short-Term Volatility Risk

A new TBT Stop Loss Hunting Alert just fired, marking the first one since April 14th. Historically, these alerts often precede short-term pullbacks, as seen with the -4.5% drop on May 23rd. According to the Multiple Factor Effect—a theory that explains how altcoins tend to overreact to BTC moves—if BTC drops another -4.5%, ALTs could fall as much as -13.5% or more. Despite this bearish signal, many of these alerts occur during bullish markets and can also precede upward volatility. Bitcoin is still holding above two key support levels on the daily chart—historical TBO Resistance around $106k and the TBO Fast line just above $105k—so a minor drop would still keep BTC macro bullish. A -4% dip would only take BTC back to the Fast line, which hasn’t been touched since April 16th. These are the kinds of dips that provide great long-term buying opportunities.

Volume Weakness Due to US Holiday, but Momentum Holds

Memorial Day in the US caused lower trading volume across all markets, reinforcing how crucial US participants are to crypto volatility. Despite the drop in volume, OBV remains strong and daily RSI is only slightly weakening. The daily TBO Slow line is beginning to curl upward, signaling continued bullish macro structure. ETH is tracking BTC closely but slightly underperforming, again supporting the Multiple Factor Effect. The good news for ETH is that it remains above both the 0.618 Fibonacci Retracement and the daily TBO Cloud—strong bullish signals. However, the 4h chart is flashing its fourth TBO Close Long, a signal that an Open Short could be coming soon. Traders should consider taking partial profits—10–30% if early in the trend, 30–50% if later—though macro charts still suggest we are in the early stages of a broader rally.
TOTAL Market Cap Suggests Early Stage Bull Run

Looking at the TOTAL chart helps clarify our market positioning. We’ve seen two daily TBO Breakouts since last week, and while not yet a cluster, the setup closely mirrors the November rally that led to a 47% gain. Volume has been increasing steadily since May 1st, supporting the case that this is the beginning of a longer, sustainable uptrend. Pullbacks are normal and healthy, especially during strong rallies. Constant green candles are a greater concern than occasional red ones. The current dip should be seen as a continuation of a broader bull phase.
Stablecoin Dominance Rising, But Not Yet Threatening
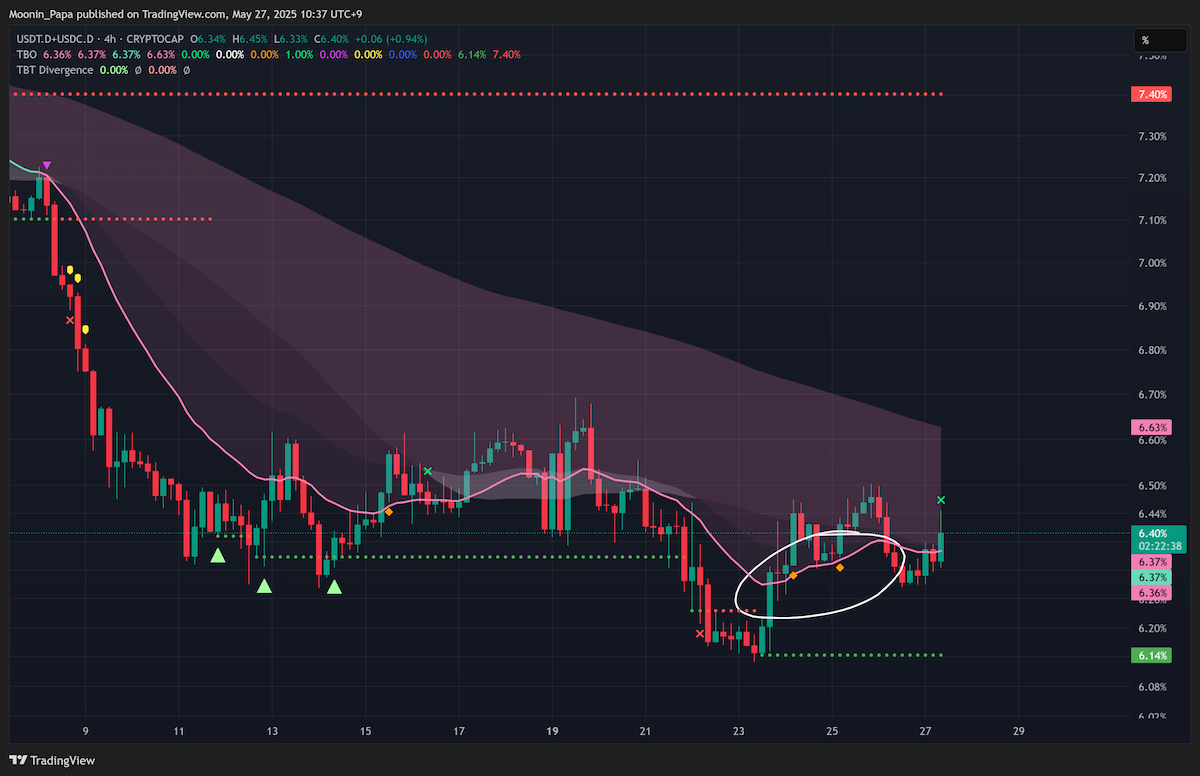
Stablecoin dominance has not yet pushed into the daily TBO Cloud, but it could if BTC continues dipping. Two recent TBO Close Longs suggest stablecoin inflows are growing, signaling that traders are exiting riskier assets. That means short-term bearish pressure across the broader market. BTC.D has printed two TBO Breakouts on the 4h chart, signaling that Bitcoin could further dominate the crypto pie. This trend supports the idea that traders are buying BTC on the dip rather than spreading funds across ALTs. As a result, Top 10 Dominance and OTHERS.D will likely lag behind, especially since Top 10 Dominance just printed a 4h TBO Breakdown cluster, a highly bearish signal. Interestingly, OTHERS.D has not yet printed any Breakdowns and looks marginally healthier in comparison.
TOTAL and OTHERS Charts Reinforce Macro Bullishness

ETH’s 4h chart and the TOTAL market cap 4h chart are both flashing multiple TBO Close Longs, reinforcing expectations of a short-term pullback. However, the daily chart for TOTAL still looks macro bullish. Volume continues to exceed the yellow MA line, OBV is rising, and the daily RSI—though below 70—is still healthy. The only lagging metric is the TBO Slow line, which remains flat. Once it turns up, it’ll be a major confirmation. Meanwhile, the OTHERS daily chart is dipping back into the TBO Cloud, shifting back to bearish consolidation. Still, rising volume and OBV suggest that buyers are present and that any bounce in BTC could spark broader recovery in altcoins.
Volatility Rising as BVOL7D Pumps Higher

BVOL7D, which measures BTC volatility, is expected to spike today due to the sudden pullback. We’re watching for it to hit the Rejection Zone (8.5 to 12.0) before falling back down—a setup that would favor the return of bullish momentum for ALTs. Historically, BVOL7D surging during BTC corrections often leads to a rebound phase shortly after.
How to Strategically Place Bids on ALT Pullbacks
For short-term entry planning, two key approaches are best. If the daily chart shows price above the TBO Cloud and Fast line (strong bullish), place bids around the daily TBO Fast line—such as HYPE’s near $30. If the chart is inside the Cloud (consolidation), use the 4h TBO Support levels to find potential entry zones, such as SOL’s $157 or APT’s $5.06, $4.71, and $4.15 levels. Always start with charts already in strong bullish positions—above the Cloud and with Open Longs—because these are more likely to bounce quickly after dips. And above all, plan your exit ahead of time. Decide your profit-taking or stop-loss strategy before entering the trade to avoid reactive mistakes during the bounce.
For in-depth strategy and tools, visit The Complete Cryptocurrency Investor by Mastering Assets.