June 3, 2025
- Gold market bears were shocked by yesterday’s powerful rally, and it’s a rally I suggested was imminent. What were the clues for it and what’s next for the world’s greatest currency?
For some exciting insight into this matter. The first item in play to note is the bull flag. It portends a surge to $3800 is in the cards… and possibly $4200.

- The second item is the large inverse H&S bull continuation pattern on the key 14,5,5 series Stochastics oscillator. These patterns are rare… and incredibly bullish.
- Interestingly, it comes not too long after an also-rare inside handle formed on the C&H (cup and handle) pattern. That was an incredibly bullish development, indicating a massive rally was imminent.
On this long-term chart, the massive inverse H&S bull continuation pattern takes centre stage.
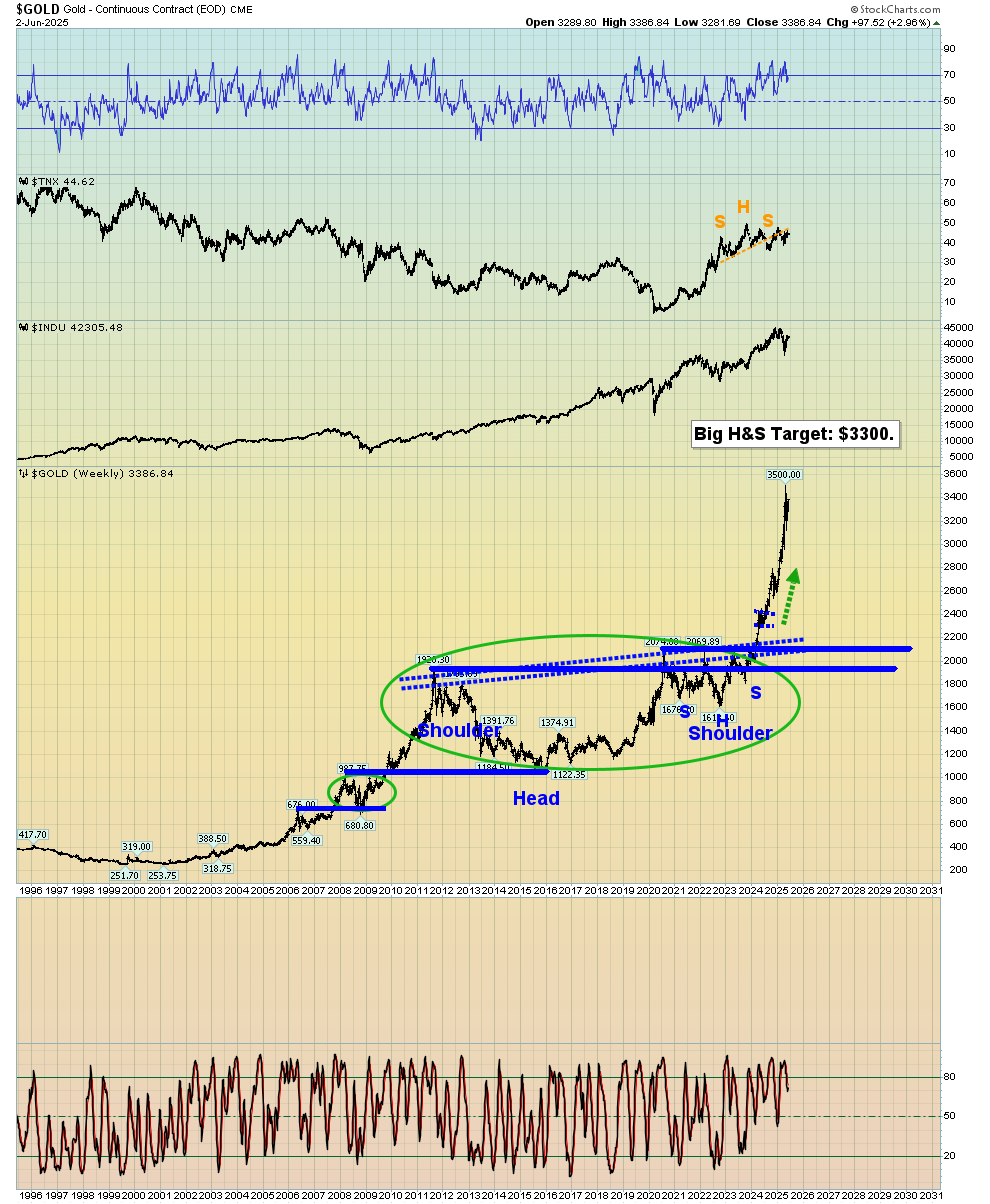
- The target was $3300, but the bigger and more aesthetic a price pattern is, the more likely it is that the technical target is not only acquired… but substantially exceeded.
- Decades ago, I set a long-term $6500 target for gold’s bull run, and I suggested that at the end of that run, gold would trade sideways… probably in a loose range between $5000-$7000. From there, an enormous Chindian citizen-oriented gold bull era would carry the price to $10,0000, $20,000, and higher.
- Given the insane refusal of the US government to begin a new gold buy program, a refusal that is occurring while it piles on ever-more ludicrous amounts of spending and debt, I’m concerned that my final target price is not factoring in enough government insanity, so I’m raising my $6500 target to $10,000.
- This government insanity, quite frankly, is spectacular news for gold bugs around the world.
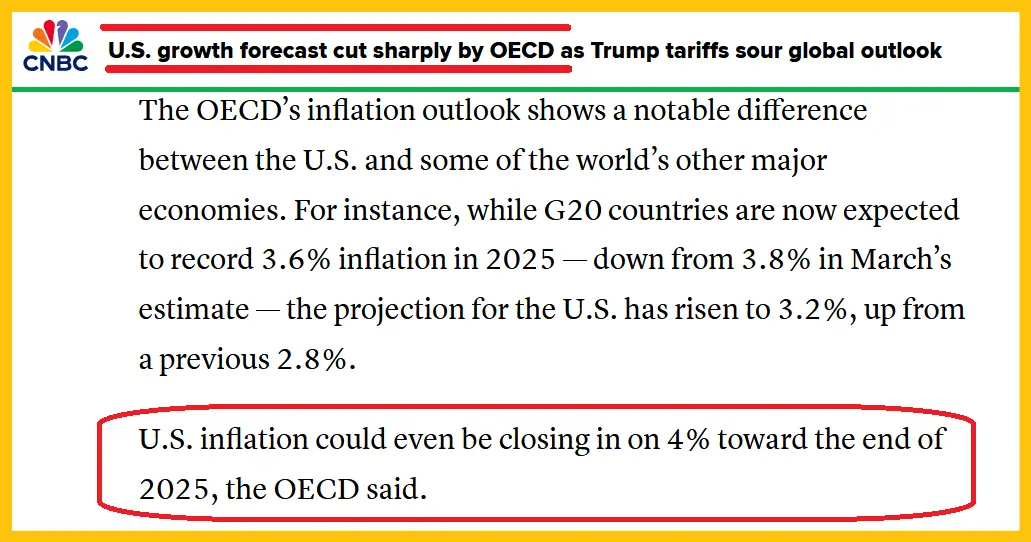
The OECD is chopping their 2025 US GDP growth target to 1.6% and hiking their inflation target to as high as 4%. This, while the US government peddles a ridiculous fantasy to its citizens that they are going to create a golden age, and do it… by buying no gold.

- Gold revaluation can’t fix the US government’s fiat and debt problem. That worked in the 1930s and 40s when the population was a third of what it is now. Then, the government had 20,000 tons of gold. It worked when the nation was the world’s most powerful creditor. Sadly, now it’s a pathetic debtor with only 8000 tons of gold to back a Mount Everest of vile fiat and debt.
- Now all that works for the fix is buying more gold. The time is now for the US government to act more like an adult than a child… and save rather than borrow.
- Issuing bonds instead of buying gold is an act of insanity.
- The bad news is that the government won’t be buying any more gold… but the good news is that savvy gold bugs will.
Double-click to enlarge this exciting CDNX chart. Yesterday I highlighted 20 CDNX component stocks making new 12month highs to junior investors.

- Of those 20, 19 were miners. The inverse H&S pattern is massive. It targets the 1500-2000 zone for the CDNX, and that should see a myriad of individual mine stocks stage 10 and 20 bagger surges on their own charts.
Double-click to enlarge this enticing CDNX/Dow chart. Why does the CDNX look so ready to dramatically outperform the Dow?

- Well, it’s typical for gold, silver, and the miners to swoon in the April-October period, mainly because Chinese and Indian buyers go quiet.
- This year could bring a rare cyclical inversion; the April low is now likely to be followed by a rally into October, and from there the metals would swoon into December, before Chinese New Year buying catapults them dramatically higher again.
- The US stock market could also begin tumbling as “tariff tax stagflation” (rising inflation and falling growth related to taxes)finally overwhelms the market and investors who have been acting like Icarus begin to fall back towards Earth. That would also fuel more interest in the miners.
Double-click to enlarge this fabulous GDX weekly chart. There’s a bull flag breakout for gold, one for the CDNX versus the Dow, and perhaps the most beautiful of them all is this one for GDX!

- Also, GDX sports the same rare (and incredibly bullish) inverse H&S bull continuation on the 14,5,5 Stochastics oscillator that is visible on the gold bullion chart.
For another very nice look at it, and then please take a moment… to stand in awe.

- First came the rare inside handle on the C&H pattern. Now there’s an incredibly aesthetic bull flag with a breakout. The time is now for the US government to buy gold, and the government is failing to do it, as expected. The time is also now, for gold stock enthusiasts of the world to take the junior, intermediate, and senior mining stocks bull by the horns… and enjoy the world’s most golden ride!
Thanks!