

BTC Pushes Higher but Faces Questions of Sustainability

Bitcoin posted an unexpected 4% gain, closing above short-term TBO Resistance at $109K and briefly tagging $110K. Volume barely cleared its daily moving average, signaling some strength behind the move. However, the real challenge lies ahead: will this price action hold or fizzle? The daily TBO and TBT Divergence indicators aren’t showing strong signals, but the TBT Stop Loss Hunting alert has now triggered for 14 straight days, a clear warning of potential volatility in either direction. Meanwhile, weekly RSI has climbed back above 70, confirming continued bullish strength—but the week isn’t over. The one missing piece is weekly Volume, which still needs to break above its average to signal broad momentum.

Alternative Cycles and Fib Targets Suggest More Upside
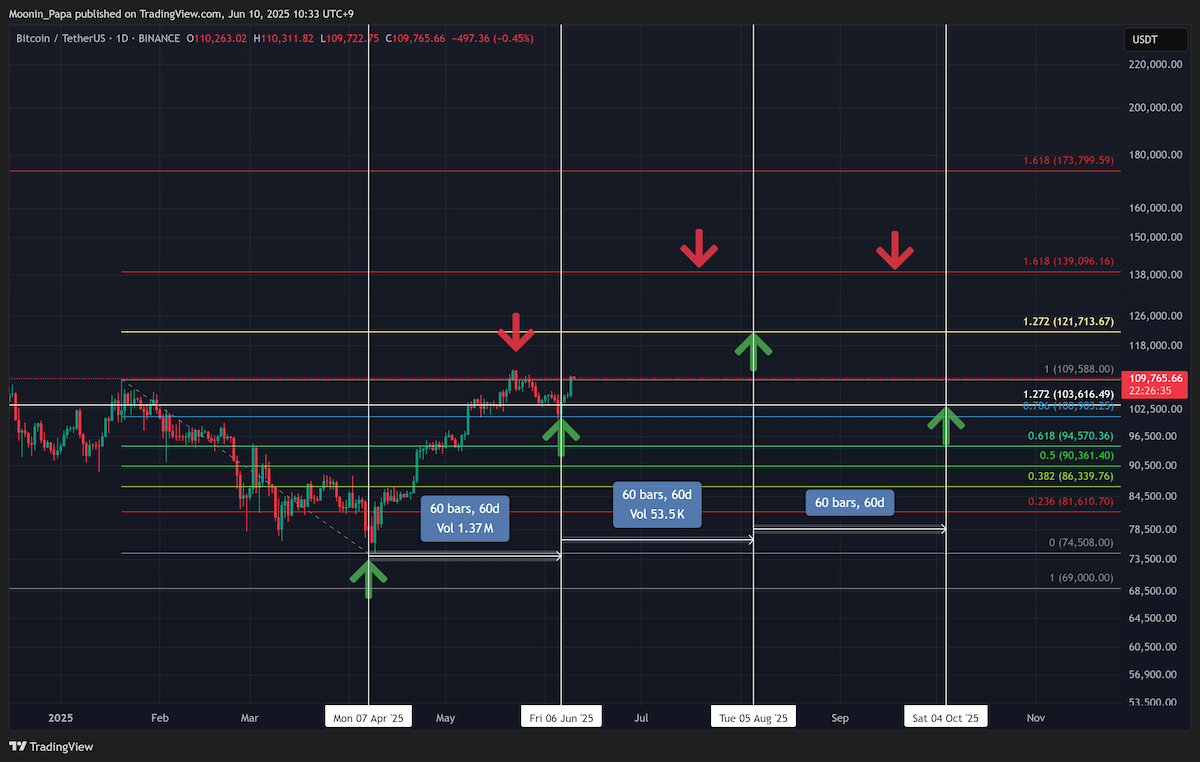
Adding another layer of insight, Bob Loukas’ 60-day cycle theory provides an intriguing lens through which to view recent action. According to Loukas, Bitcoin hit its second 60-day cycle low on June 6, and could now be beginning another leg up. Based on prior cycle behavior and Fibonacci Extensions, the next potential target lies around $139K, a 40% increase. While a more aggressive target of $173K exists, the data doesn’t currently support such a large move yet. Loukas’ theory points to a higher low next, followed by a blow-off top and eventual cycle completion.
The Bearish Signal No One Wants to See

Despite bullish daily and weekly setups, one major signal is quietly flashing in the background: the TBO Bear Formula. This sequence—two TBO Close Longs, a red Cross Down, followed by an Open Short—has reliably marked the onset of bear markets since 2018. We’ve already seen the first step with two TBO Close Shorts. While this doesn’t mean a crash is imminent, it’s a serious warning that the top may be near. Even though on-chain data and macro indicators don’t yet scream "top," the convergence of signals across multiple methods suggest that we’re entering the final act of the bull market.
Timing the Top with Historical Cycles

Multiple time-based measurements support the idea that we are in a top year. Comparing the number of weekly bars from previous all-time highs and market bottoms points to key dates ranging from September 15 to November 24, depending on which cycle you reference. Whether it’s 152 bars from the bear market bottom or 78 weeks post-halving, nearly all projections center around October 2025. That’s uncomfortably close. While Bitcoin has been known to deviate from models, the repetition in timing across years suggests these aren’t coincidences.
Preparing for the Endgame

The writing on the wall is clear: we are likely in the late stage of this bull market. That doesn’t mean panic—it means precision. The coming weeks and months could provide the biggest opportunities of this cycle. Traders should reassess their portfolios, tighten profit-taking strategies, and watch Bitcoin Dominance (BTC.D) for any sign of rotation into alts. Once BTC.D meaningfully retreats and stablecoin dominance drops, the capital rotation into altcoins may begin. But for now, BTC remains dominant and the broader market continues to lag.
Focus on Execution, Not Prediction
Chasing exact price targets like $173K may lead to disappointment or missed profits. The priority now is to focus on executing a clear plan. This final phase of the bull market is where outsized gains are made—but only if traders are mentally and strategically prepared. Stick to the plan, take profits when they hit your targets, and above all, protect your capital. The end of the cycle is not the time to get greedy—it’s the time to get smart.
For in-depth strategy and tools, visit The Complete Cryptocurrency Investor by Mastering Assets.