

BTC Steadies, But Momentum Weakens

Bitcoin closed above short-term TBO Resistance at $109,284, but the daily candle was far from convincing. Still, the TBO Slow line on the daily has finally started curling upward, a welcome shift after weeks of weakness. Daily Volume didn’t exceed its moving average, but RSI and OBV remain supportive. Meanwhile, the TBT Stop Loss Hunting alert continues its marathon streak—now at 16 days. Despite all this, BTC bounced strongly from $100K and is showing resilience. But it still needs to push above $110,718 with weekly RSI above 70 and stronger Volume to regain real momentum.
ETH Takes the Spotlight with Back-to-Back Breakouts

Ethereum outshined BTC with a 5% surge and a decisive close above TBO Resistance at $2,768. Even more impressive, ETH printed a TBO Breakout on yesterday’s close and is already working on a second one today. Volume came in double the daily average, giving the move even more weight. Although there are still some warning signals like TBT Bearish Divergences and a downward-sloping TBO Slow line, the technical damage is fading fast. ETH’s weekly chart looks even stronger: RSI is holding above 70 and price is back above the weekly TBO Cloud, signaling renewed bullish strength.
ETH/BTC Moves and Dominance Shifts Favor ETH

As expected, ETH’s dominance grew substantially—up 4.16% on the day—fueling a continued surge in ETH/BTC, which is now testing the 0.236 Fibonacci Retracement level. If this level breaks with a daily close, ETH could finally start outpacing BTC significantly. Stablecoin dominance dropped again, indicating risk-on behavior across the market, while BTC Dominance slid inside the daily TBO Cloud. Daily RSI for BTC.D fell to 39.10, suggesting further weakness. OTHERS.D popped 2.6% and re-entered the daily Cloud, while ETH.D continues to lead, now clearly strong bullish on the daily chart.
Market Cap and Macro Charts Add to the Bullish Case
TOTAL market cap is approaching a major resistance level not tested since late May. Weekly RSI is nearing 70, which would confirm broader market strength. Volume is already above average. OTHERS is also moving back to overhead resistance, looking ready for another breakout. BVOL7D shows signs of life as volatility begins to creep back in, ideally to the upside. In TradFi, the DXY appears locked in a bearish wedge. Historically, breakdowns in the dollar have preceded crypto bull runs—2020 and 2017 offer eerily similar setups. The VIX continues to fall, reflecting low market fear, while Gold looks weaker with declining Volume and OBV despite holding above the TBO Cloud.
Altcoins Are Finally Waking Up
The Altcoin market lit up yesterday. SOL is pushing toward resistance at $178 after reclaiming the daily TBO Cloud. ADA printed a TBO Close Short, signaling a bullish reversal. LINK, XLM, LTC, and many others followed suit with similar signals. TON broke above long-term resistance and printed a TBO Open Long. BCH printed a TBO Breakout, and even OM—despite prior bearish sentiment—triggered reversal signals on the 4h chart. HYPE hit a higher local high and confirmed a cluster of Breakouts, reinforcing the strength that’s been building for days. UNI pumped 27% with 4x daily Volume. AAVE printed a second daily TBO Breakout, and COMP closed up 19%.
SPX6900 Stands Out with a Perfect Breakout Cluster
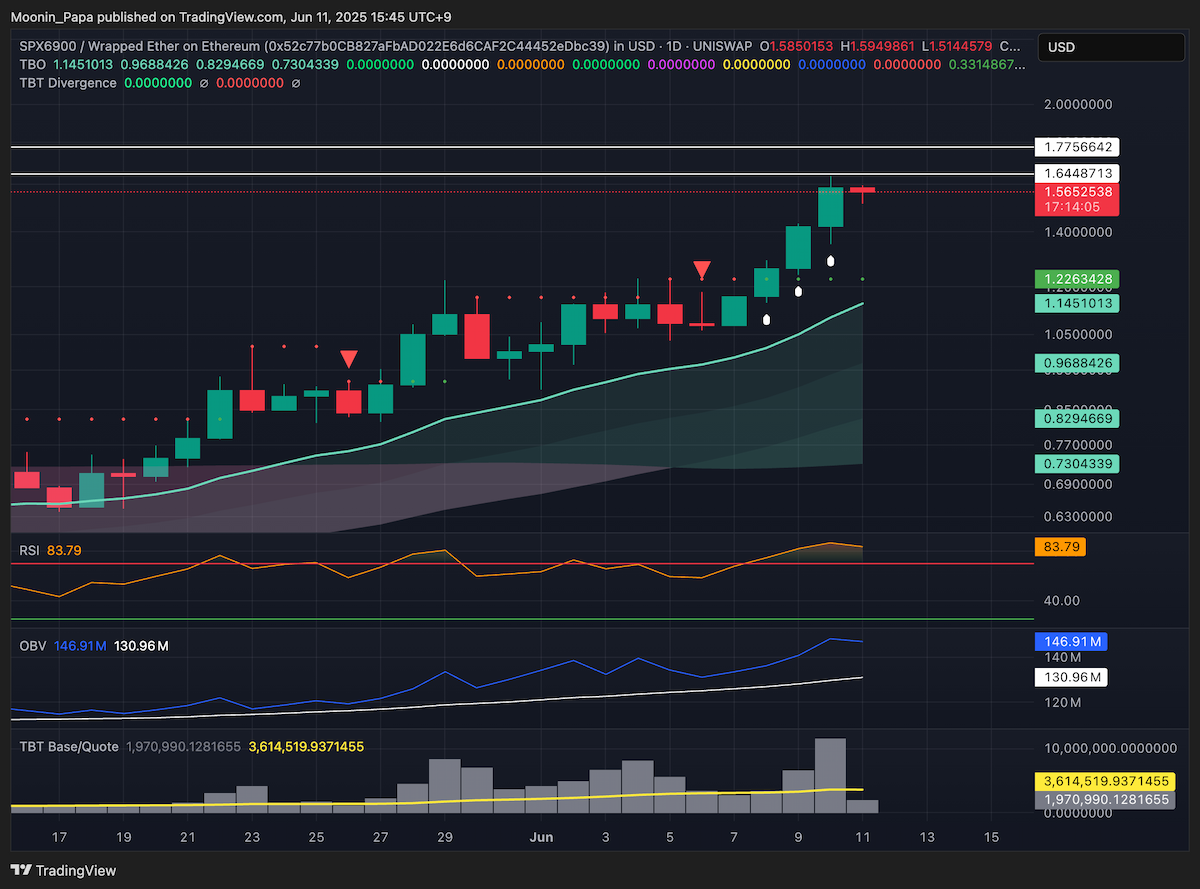
The standout performer was SPX6900, which confirmed a perfect TBO Breakout Cluster while reaching historical resistance. Volume hit a new high, and weekly RSI looks set to climb higher. Despite the short-term rejection, the chart still has plenty of upside potential—possibly toward $3. But as always, the best traders focus on execution, not perfection.
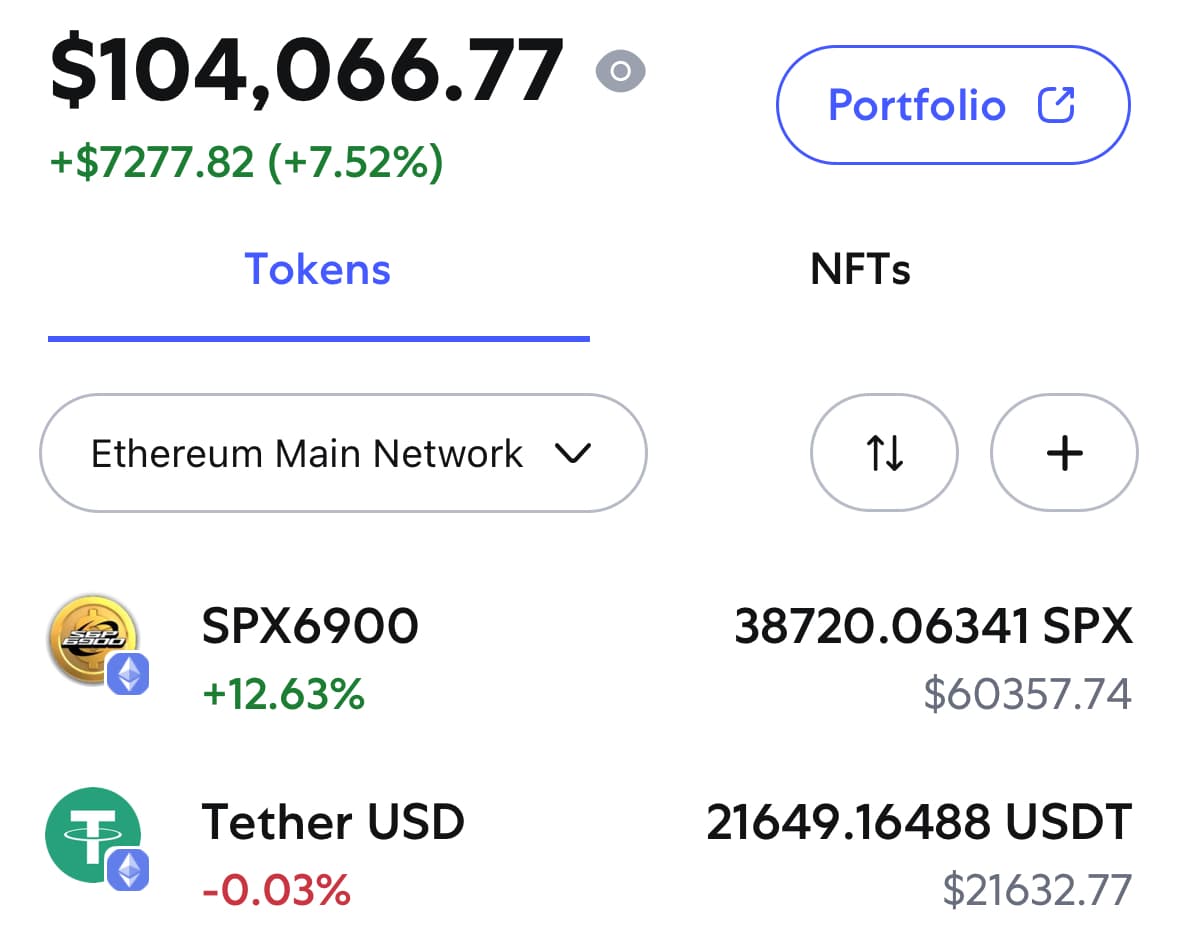
Taking profit when it’s available, like locking in $21K on SPX6900, is not a loss—it’s maturity. Following the plan means staying sane when volatility hits.
For in-depth strategy and tools, visit The Complete Cryptocurrency Investor by Mastering Assets.