

BTC Struggles with Divergences Despite Strong Weekly Structure
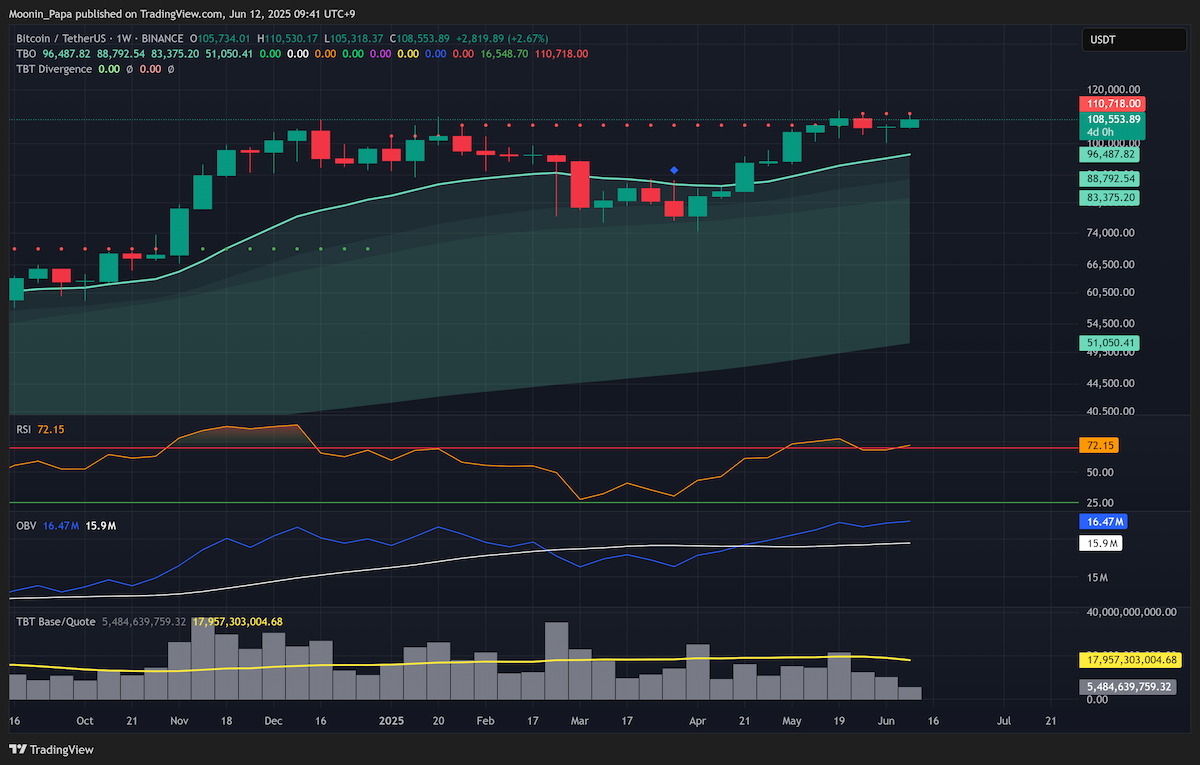
Bitcoin closed slightly red yesterday, down about 1.5%, but it’s still trading above the daily TBO Cloud. The Slow line on the daily continues to curl upward, offering some hope. However, the 4h chart has now printed two TBT Bearish Divergences. These signals have preceded brief pullbacks in the past, but context matters. When the 4h TBO Slow line is trending up—as it is now—these divergences tend to be less threatening. Still, it’s wise to exercise caution, especially with the Stop Loss Hunting Alert continuing its 16-day streak. On the weekly chart, RSI is still strong above 70, and OBV is ticking upward alongside its moving average. These two weekly metrics suggest BTC’s macro trend remains strong bullish, but current resistance near $110K remains a major hurdle.

ETH Faces Mixed Signals Across Timeframes
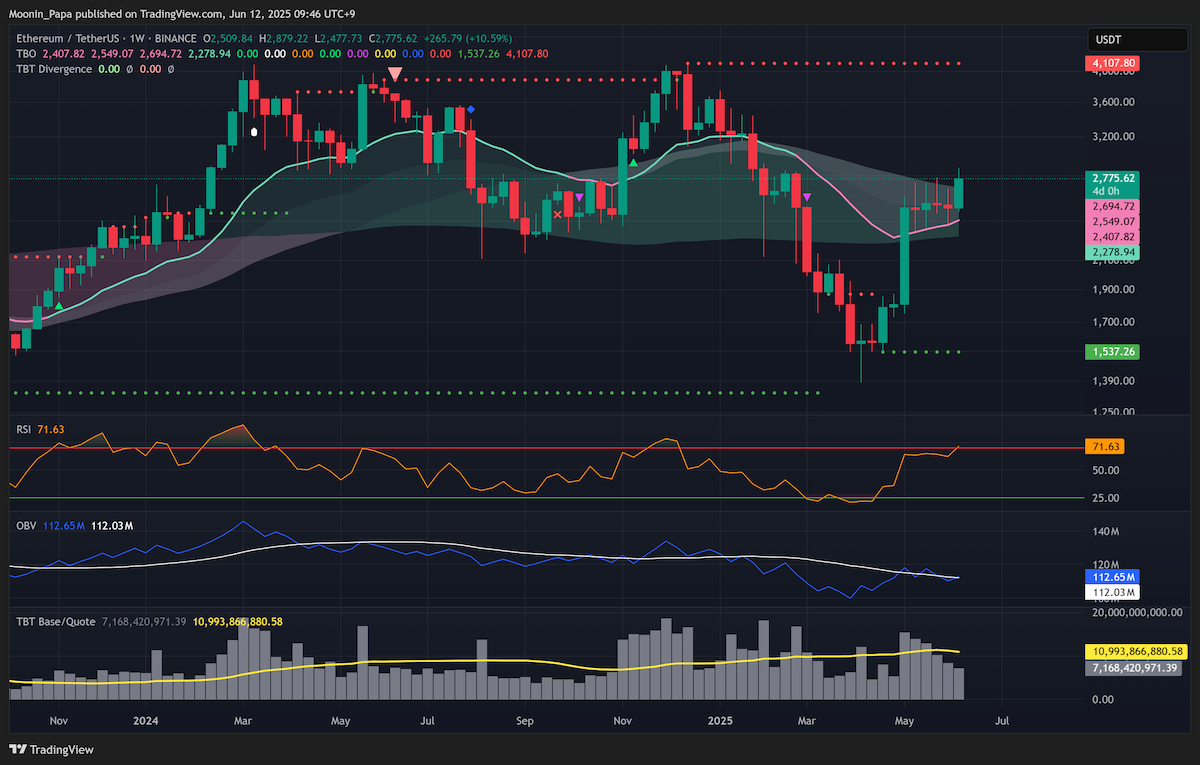
Ethereum lost its in-progress TBO Breakout on the daily close and instead printed a third TBT Bearish Divergence Cluster—hardly encouraging. While Volume, OBV, RSI, and price remain positive, the daily TBO Slow line continues pointing down, reflecting a still-bearish macro trend. The contradiction is heightened by the 4h chart, which just printed a TBO Breakout Cluster. The signals are conflicting, so zooming out becomes critical. On the weekly timeframe, ETH still looks healthy. Price is well above the TBO Cloud, weekly RSI holds at 71.63, and Volume is on pace to exceed last week’s bar. The bigger picture supports ETH’s bullish structure, even if short-term noise adds uncertainty.
Stablecoin Dominance and BTC.D Show Signs of a Reversal Battle
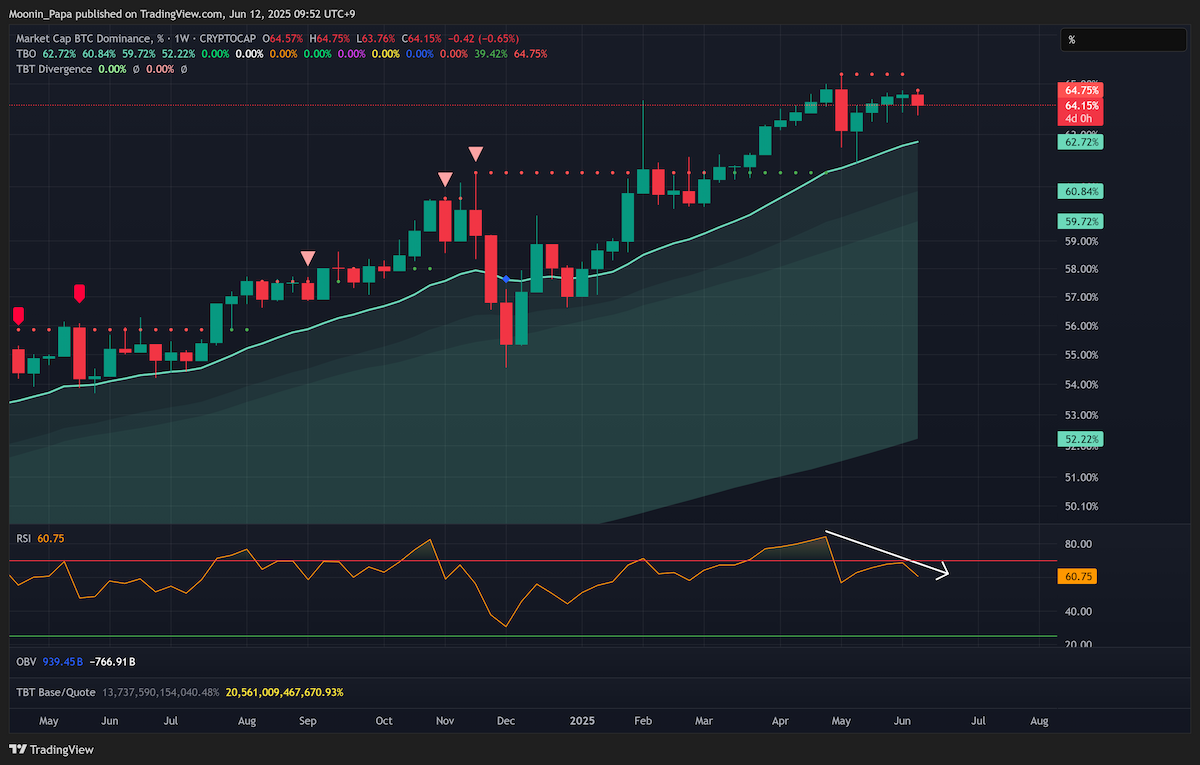
Stablecoin Dominance closed up 1.62% yesterday with a minor bullish engulfing candle. The daily TBO Slow line continues rising, and the 4h chart just flashed a TBT Bullish Divergence. However, similar signals in the past have been unreliable, so it’s best taken with skepticism. BTC Dominance dipped inside the daily TBO Cloud recently but looks like it’s headed back above it today. On the weekly chart, BTC.D is still strong bullish overall, though weakening RSI could be a sign that BTC.D has topped out. Top 10 Dominance remains bearish, while OTHERS.D dipped below the daily TBO Cloud. ETH Dominance barely moved but continues to hold above the daily Cloud and is now consolidating inside the weekly Cloud. Weekly RSI for ETH.D is climbing toward 70, a possible sign of sustained bullish strength—again conflicting with the bearish signals seen yesterday.
BVOL7D Points to Incoming Volatility, Direction Unknown
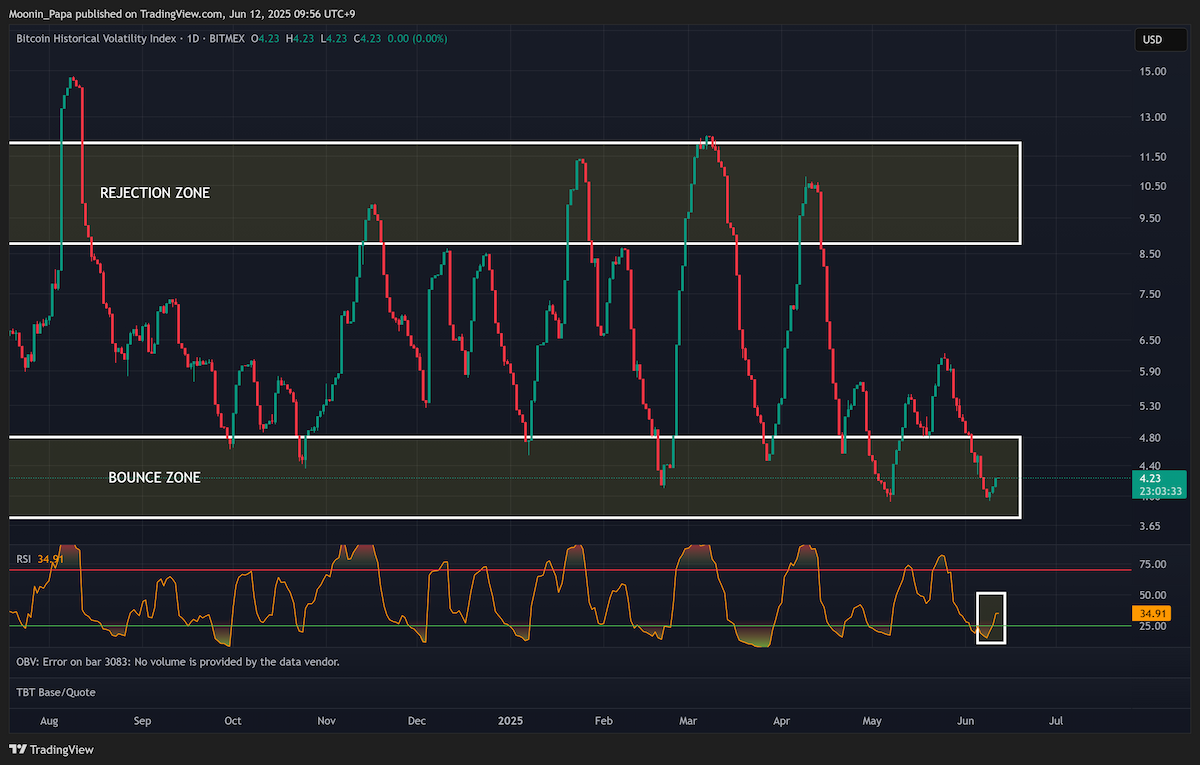
BVOL7D confirmed an RSI Reset yesterday and has started climbing toward the Rejection Zone. It’s still stuck in the Bounce Zone for now, but if the increase continues, we should expect more volatility in the coming days. As always, BVOL7D doesn’t predict direction—only volatility—so we’ll need to stay sharp and watch how BTC responds.
SOL and TRX Deliver Opposing Surprises

In the altcoin world, SOL is tightening up inside a very narrow daily TBO Cloud with increasing Volume, suggesting a big breakout could be imminent. ADA retraced to its daily TBO Fast line after printing a TBO Close Short yesterday, hitting the expected entry point. TRX, which often acts as a market leader, had a shock -4% move yesterday—unusually large for a chart that rarely deviates by more than 1%. This kind of dramatic drop could indicate that BTC is preparing to pump, acting as an inverse signal. If TRX doesn’t bounce soon, it may lose its bullish momentum as weekly RSI slips below 70.
Most ALT Signals Retraced, Offering Clear Re-Entries

Most altcoins that printed TBO Close Shorts yesterday successfully retraced to their TBO Fast Lines. ICP is one of them, holding strong above TBO Resistance at 5.991 and showing rising Volume. On the weekly chart, it’s wicking back into the TBO Cloud for the first time since January, and RSI is curling upward—good signs despite weak OBV. AAVE printed a third TBO Breakout yesterday on a slightly red candle, which is still valid. The next target lies at the 0.786 Fibonacci Retracement level around $376. MKR is retracing after tagging the 0.618 Fib level. JTO printed a TBO Open Long with explosive Volume, though price couldn’t hold above historical resistance. KAIA surged nearly 18% and is approaching its 0.5 Fibonacci level. A 4h Breakout Cluster further confirms its strength, and 0.618 remains a realistic short-term target.
SPX6900 Leads the Pack, While MINA and MASA Tease Early Moves
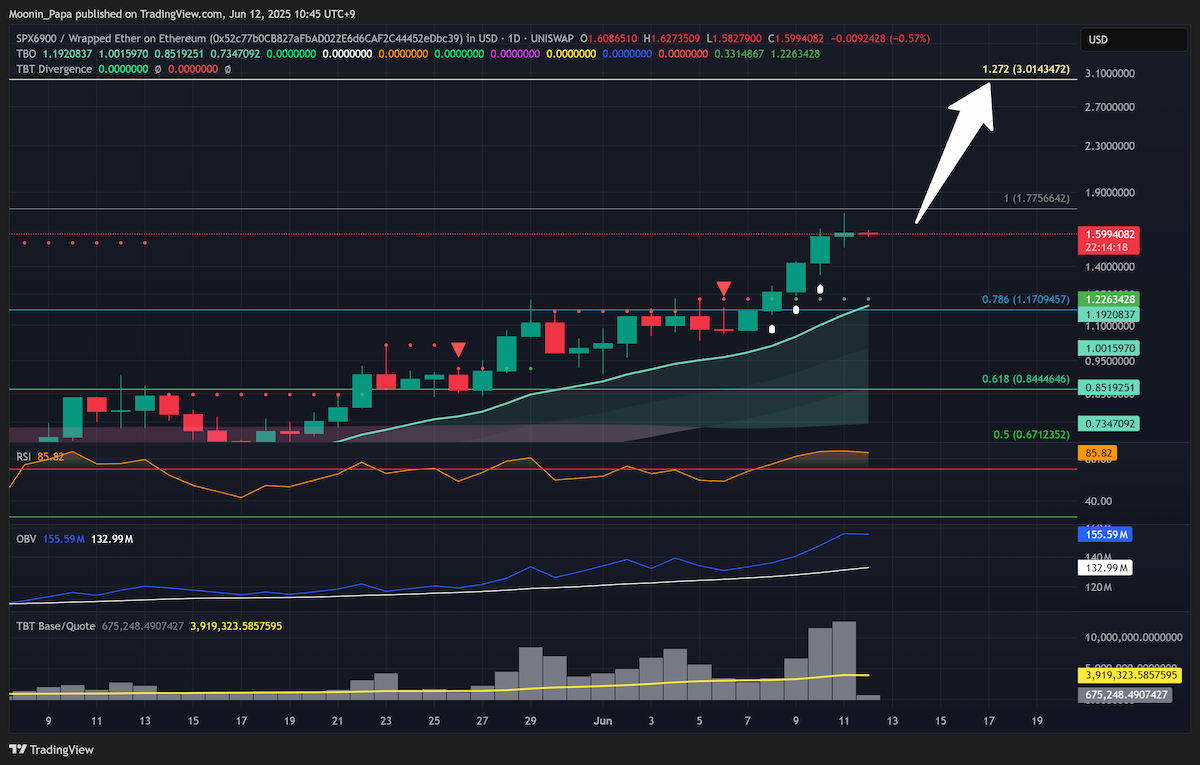
SPX6900 had another strong session, nearly touching its 1.0 Fib retracement near 1.77. Despite being due for a pullback, it remains heavily bid with strong Volume. The long-term target sits at the 1.272 Fibonacci Extension at 3.01. MINA spiked 27% yesterday, showing early signs of another KAIA-like run, while MASA is in the process of printing a TBO Close Short. It’s early days for both, but these setups warrant attention.
For in-depth strategy and tools, visit The Complete Cryptocurrency Investor by Mastering Assets.