

BTC Recovers Quickly After Israel-Iran Conflict News Sparks Panic

Bitcoin briefly dropped after news broke that Israel had launched a missile strike on Iran, reportedly targeting a nuclear weapons facility. This caused an immediate market-wide dip, as seen in the sudden crash in crypto prices and the broader S&P Futures, which dropped about 1.5%. However, BTC is already showing signs of recovery, suggesting that demand remains intact despite the geopolitical shock. Gold surged over 1%, crude oil spiked with a massive upper wick but little volume to support it, and WTI’s reaction is raising red flags even if it lacks confirmation. Global volatility is clearly elevated, but the lack of escalation so far offers some hope that the event might pass without further destabilization.

Stablecoin and Bitcoin Dominance Reflect Renewed Dip-Buying Interest
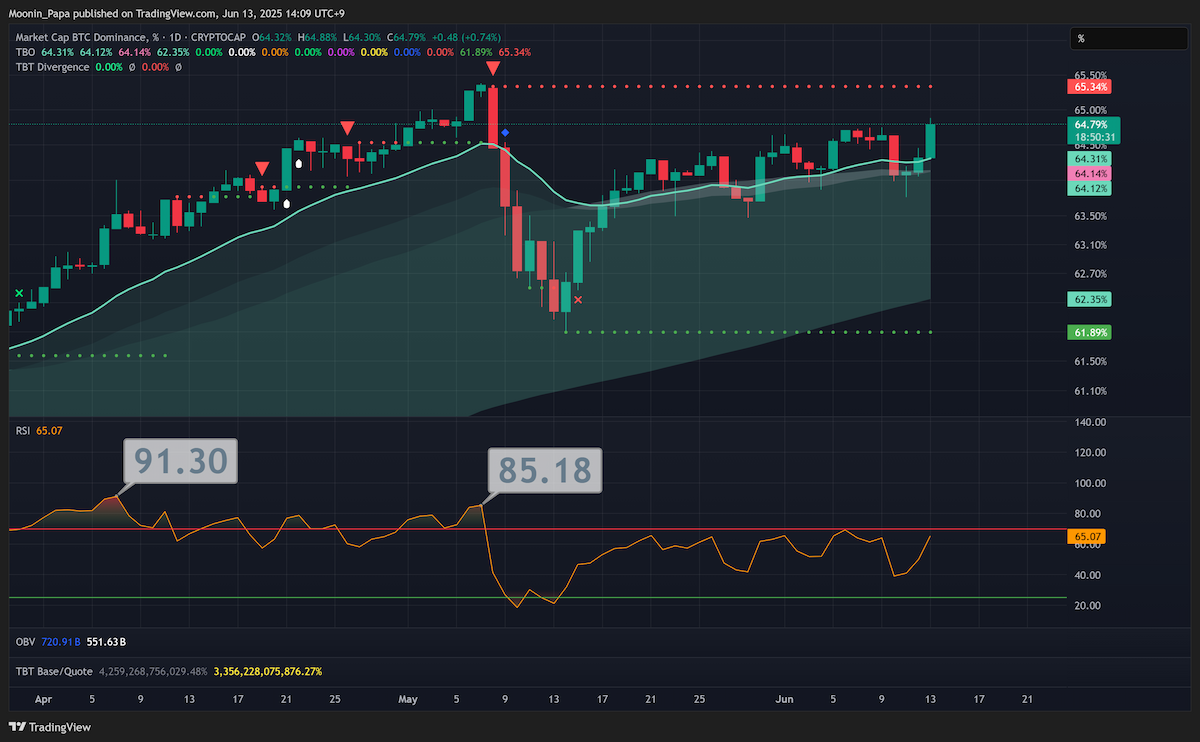
Stablecoin Dominance is showing a TBO Close Short in progress, aligning with increasing volatility, but RSI has yet to reach overbought levels despite over $1 billion in liquidations. Bitcoin Dominance is up 0.74% and climbed decisively above the daily TBO Cloud, reflecting growing demand for BTC during the selloff. Interestingly, this upside move wasn’t enough to push daily RSI above 70. Still, BTC.D rising while BTC dipped confirms dip-buying is in play. On the 4h chart, BTC printed a long lower wick and 4x volume on the open, a classic bottoming candle structure. Though it’s early to call it a firm low, price recovery and strong dominance movement suggest BTC has likely found temporary support.
Top 10 and Altcoin Dominance Still Bearish, Highlighting Weakness in ALTs

While BTC shows resilience, Top 10 Dominance and OTHERS.D are both still stuck in strong bearish trends, remaining below the daily TBO Cloud. OTHERS.D appears on track to print a second TBO Breakdown, underscoring continued ALT weakness. ETH Dominance is down 3%, an important signal that demand is concentrated in BTC rather than spreading to the rest of the market. If ETH had true strength here, ETH.D would be rising alongside BTC’s dip, but it's clearly not.
TOTAL Market Cap Faces Resistance While BVOL7D Warns of Incoming Volatility
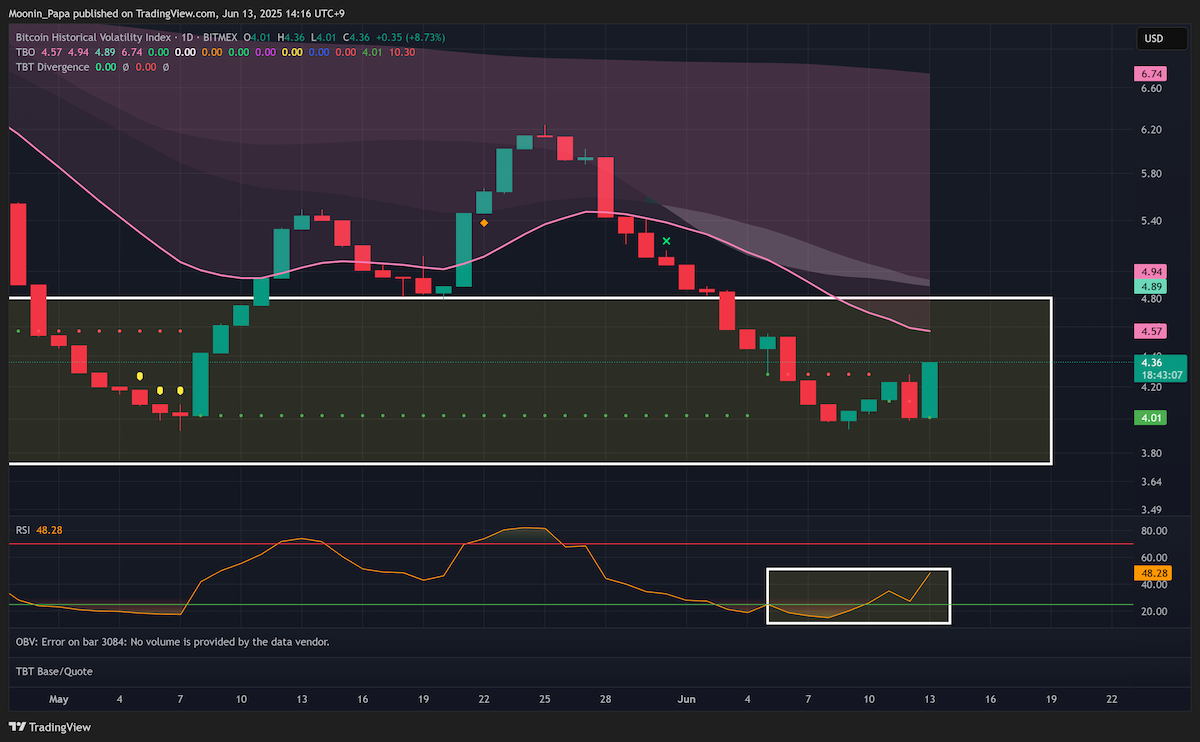
The TOTAL market cap chart is showing a potential TBO Close Long in progress, which is concerning. It continues to face stiff resistance around the 3.5T zone, with chop inside and around the daily Cloud indicating that it may take more time to reclaim bullish momentum. Meanwhile, BVOL7D jumped 8.73% and is finally making a real attempt to leave the Bounce Zone. This rise in volatility will likely hit altcoins harder, regardless of whether BTC moves up or down, so caution and planning are essential.
ALT Strategy: Focus on Strength, Not Just Deep Pullbacks

During pullbacks like this, the best approach is to focus on charts that were already showing strength before the dip. HYPE is a textbook example, sitting well above the daily TBO Cloud. Use the daily TBO Fast line as your first re-entry point, and consider scaling in with one-third of your intended position size. Leave the rest for potential deeper dips. AAVE and SPX6900 also fit the bill as strong bullish charts worth watching.

Avoid charts like XRP, which was already in bearish consolidation or trading below the Cloud. Even if these charts drop more, they don’t offer a good trend structure to support a rebound. It's tempting to chase the biggest losers for bottom entries, but that tactic carries higher risk.
Final Thoughts: Always Have a Clear Trading Plan Before Entering
No matter how attractive a dip looks, you need a clear plan before entering any trade. Define your targets—will you take profits on the bounce, and how much? Will you hold a portion longer term? Without a plan, you’re just gambling. Protecting your capital is far more important than catching the exact bottom.
For in-depth strategy and tools, visit The Complete Cryptocurrency Investor by Mastering Assets.