
Bitcoin Coils Below $110k Resistance

Bitcoin continues to press against its stubborn overhead resistance just above $110k, failing yet again to break through the June 9 swing high of $110.53k. Yet, the fact that the price has not dumped after multiple rejections is encouraging. BTC remains above the daily TBO Cloud, and the Slow line has begun to curl upward—evidence of growing macro bullish structure even as daily volume, OBV, and RSI remain flat. Heatmaps on Coinglass and the Bitcoin Exchange Liquidation Map show heavy short liquidations clustered above $110k, suggesting that a breakout could trigger a squeeze higher.

Stablecoin Dominance Signaling Bullish Strength For ALTs
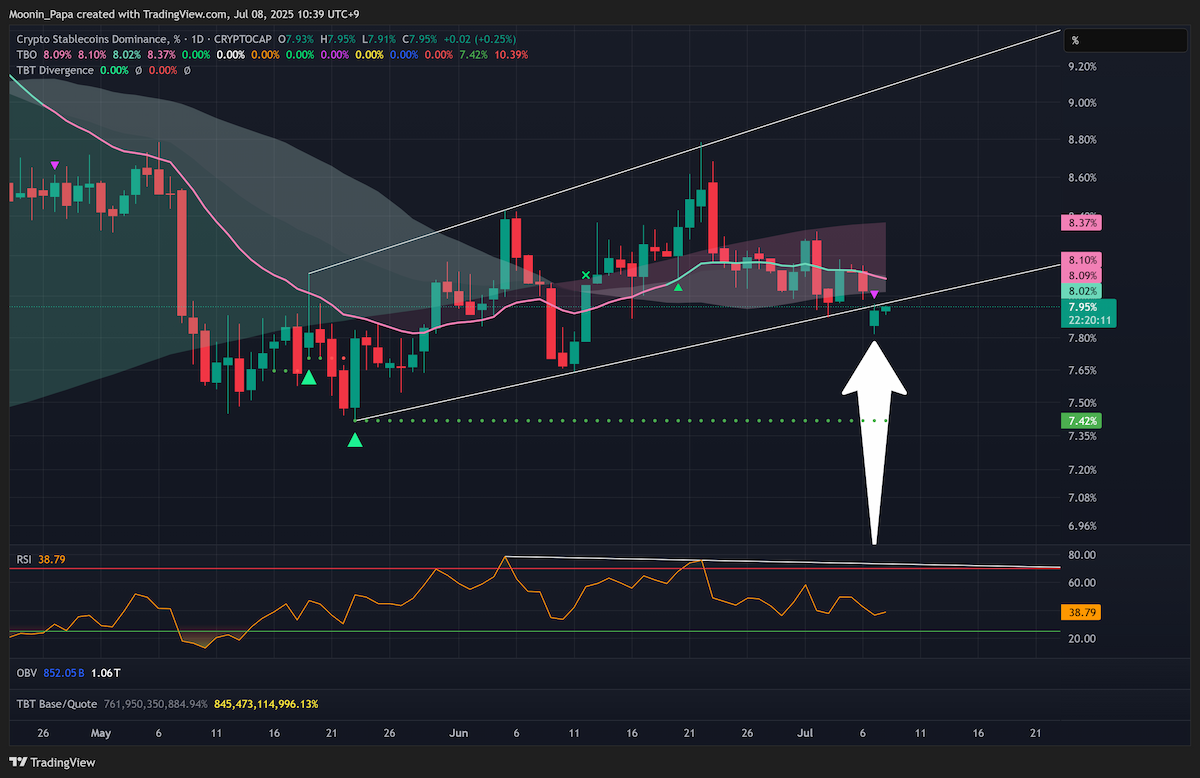
Glassnode’s Long/Short-Term Holder Supply Ratio continues to fall, a pattern seen before rallies in October and January. While price action doesn’t yet scream bullish, the backdrop of falling stablecoin dominance, which closed below support and printed a TBO Open Short, hints at capital rotating back into crypto. If STABLE.C.D drops further toward 7.42%, it would reinforce this bullish narrative. Meanwhile, Bitcoin dominance has pierced the daily Cloud several times over the past week and seems likely to close inside soon—another supportive sign for altcoins.
Altcoins Show Mixed Strength

XRP wicked up into long-term resistance and is on the verge of printing an Open Long, while SOL continues to put in lower highs under seller pressure despite improving OBV. SUI struggles to hold support, while LTC and ONDO face resistance clusters on the 4h.
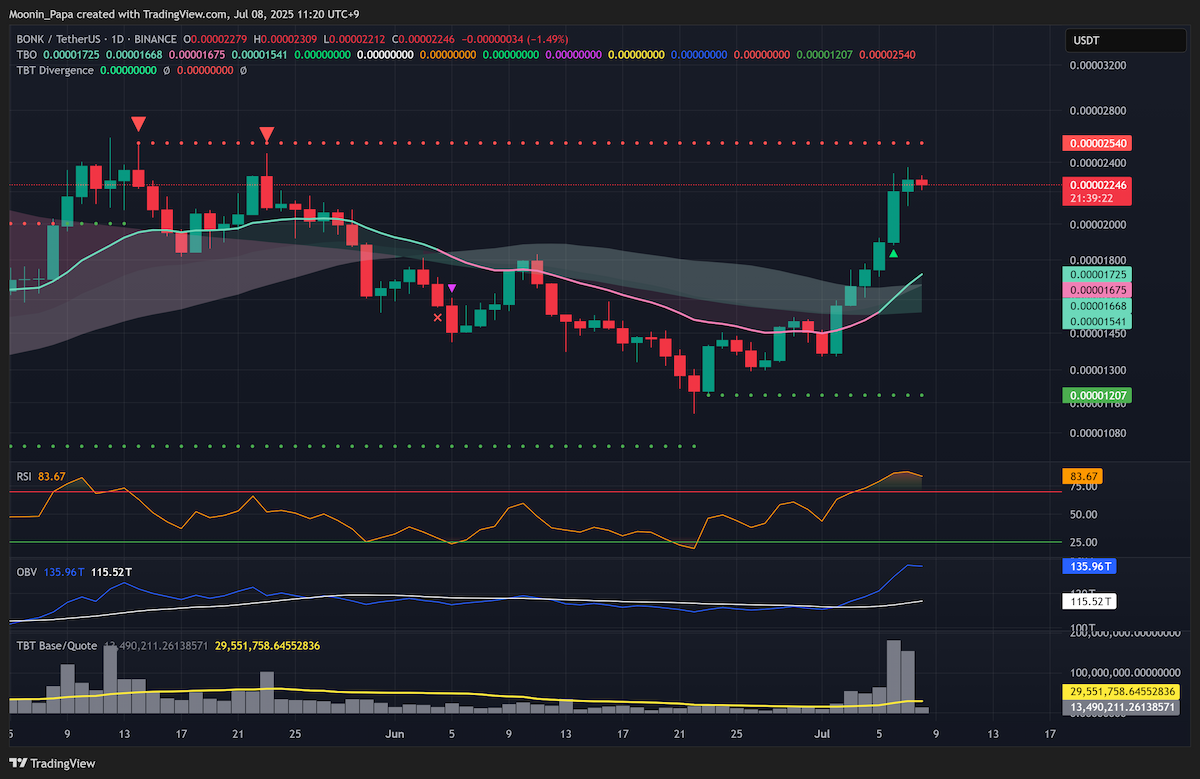
BONK’s rally looks overextended after printing 4h Bearish Divergences, whereas SEI has finally tagged its daily Fast line for a potential springboard bounce.
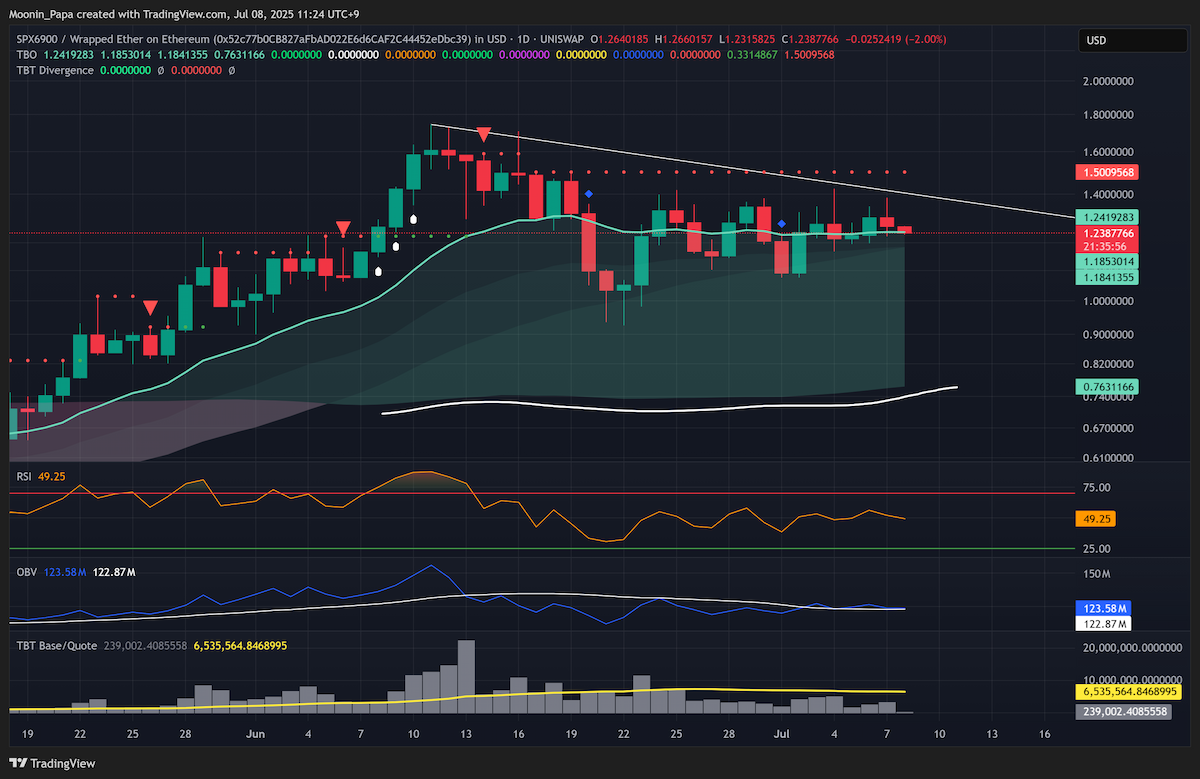
Other standouts include SPX6900 curling upward at the top of its Cloud, XDC printing a 4h Breakout cluster, and HNT reclaiming its Cloud for bullish consolidation.
Outlook Hinges on Breakout or Pullback
The market’s next move depends on Bitcoin’s ability to decisively close above $110k. If successful, a squeeze could fuel a run to the measured flag target. But if resistance holds, a pullback to the daily Fast line remains possible before the uptrend resumes. For now, patience and close attention to structural signals remain key.
For a deeper understanding of how to interpret on-chain metrics, liquidation maps, and TBO signals to build your crypto investing edge, visit The Complete Cryptocurrency Investor by Mastering Assets.