
Bitcoin Maintains Bullish Structure Despite Pullback

Bitcoin cooled off slightly yesterday, dipping to $116k, yet it continues to look strong as long as it holds above the daily TBO Cloud and the Slow line keeps curling upward. Price action remains constructive, printing a higher low compared to Friday — a sign of resilience. However, traders should watch for a potential test of the CME gap around $114k, with the TBO Fast line near $113k offering a likely springboard level if downside continues.

On the upside, the predictive wick to $123k earlier this week suggests that level remains a near-term target. Should momentum pick up again, $127k and even $139k are the next Fib-based resistance levels. Encouragingly, daily volume on the BTC Index surged to levels not seen since February, signaling that the market is still just getting started.

Ethereum Strength Signals Broader Altcoin Momentum

Ethereum outperformed again, closing up 4% and pushing ETH/BTC through the 0.236 Fibonacci level while printing consecutive TBO Breakouts on the daily. This is a classically bullish signal for Altcoins, further confirmed by the ALT Season Index rising to 39 — historically still far from peak levels seen above 75.

Across dominance charts, Bitcoin Dominance fell sharply, closing down over 1% with a TBO Open Short now in progress. This is paired with slow upward shifts in Top 10 and OTHERS dominance and a notable flattening of the OTHERS Slow line, all suggesting the macro trend is turning increasingly favorable for ALTs. ETH Dominance itself printed a daily TBO Breakout and appears to be mirroring early 2020’s bullish reversal.
Deep Dive on TOTALE Metrics Points to an ALT Season Setup
Close analysis of TOTALE50.D and TOTALE100.D — measuring market share for coins outside the top 50 and top 100 — reinforces the ALT Season narrative.

TOTALE50.D bounced decisively off historical support at 1.7% and broke above its Resistance Fan, a classic V-shaped reversal pattern seen at the start of previous ALT Seasons. Multiple TBO Close Shorts and TBT Divergence signals cluster at these lows, a strong early-reversal indication.
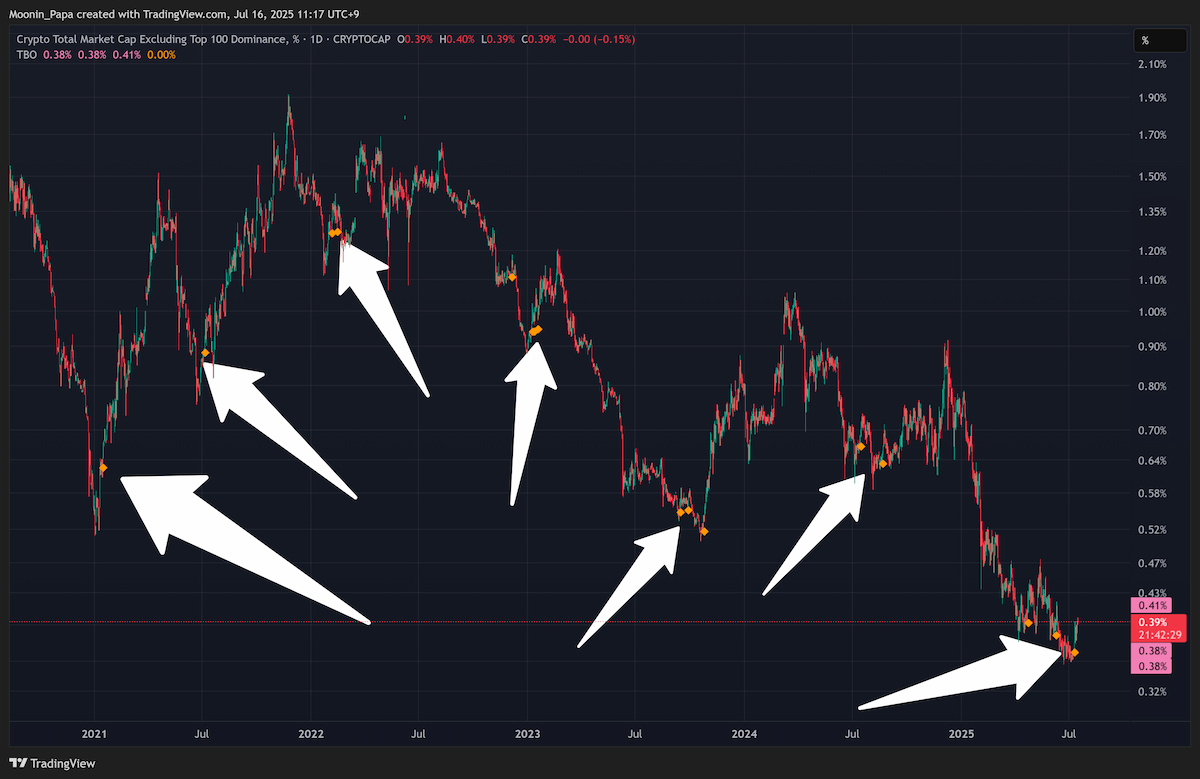
Similarly, TOTALE100.D, though at an all-time low percentage-wise, shows three recent TBO Close Shorts and corresponding V-shaped patterns, hinting at the potential for explosive moves in low caps typical of ALT Seasons. These dominance shifts, combined with historical context, make a strong case that a multi-month ALT Season is underway.
Staying Disciplined Through ALT Season Volatility
With ALT Season’s volatility ramping up, traders should enter with clear plans and avoid overextending themselves. Allocate larger positions early in rallies, keep portfolios focused rather than overly diversified, and remain realistic about the short-lived nature of these euphoric periods. Avoid using leverage, as liquidation risks rise sharply. Pay attention to any significant Bitcoin pullback, as it often signals the beginning of the end for ALT Season momentum. Most importantly, follow your plan, take profits with discipline, and don’t get swayed by online noise or hype.
For more on how to trade ALT Season effectively — and how to read predictive wicks, dominance trends, and springboard setups — visit The Complete Cryptocurrency Investor by Mastering Assets.