July 22, 2025
- Gold and silver look fabulous… and a big rally could be imminent.
For a look at the daily gold chart. The triangle target is $3800 and if it plays out silver should challenge its all-time highs at about $50.

To view the weekly gold chart. Excitingly, the symmetrical triangle target on the weekly chart is the same as it is for the ascending triangle on the daily chart… $3800!

- The big gold and silver price drivers right now are the astronomical US government debt and the administration’s truly bizarre and macabre claim that the debt is “big and beautiful”.
- Central banks and sovereign wealth funds are horrified. They are racing to diversify into gold (and silver could be next) to hedge against the debt worship madness.
- Their diversification appears to be intensifying almost weekly.
- It’s also clear that the US government wants tariffs on almost all goods imported into the country. There have been a lot of delays and cancellations, but August 1st appears to be a bigger “line in the sand” for the implementation of these stagflationary taxes.
Interestingly, August 1st is also the start of my Aug1-Oct31 US stock market “crash season”.

- Note the rising volume on the recent fall into Dow 37,000 and the lacklustre volume on the ensuing rally. The big concern:
- The stock market has gone nowhere in almost a year and now a grim tariff tax reaper is only a week away from wreaking potential havoc on American corporate earnings… and hiking the prices of a vast array of products that millions of hard-working citizens can barely afford to pay for now.
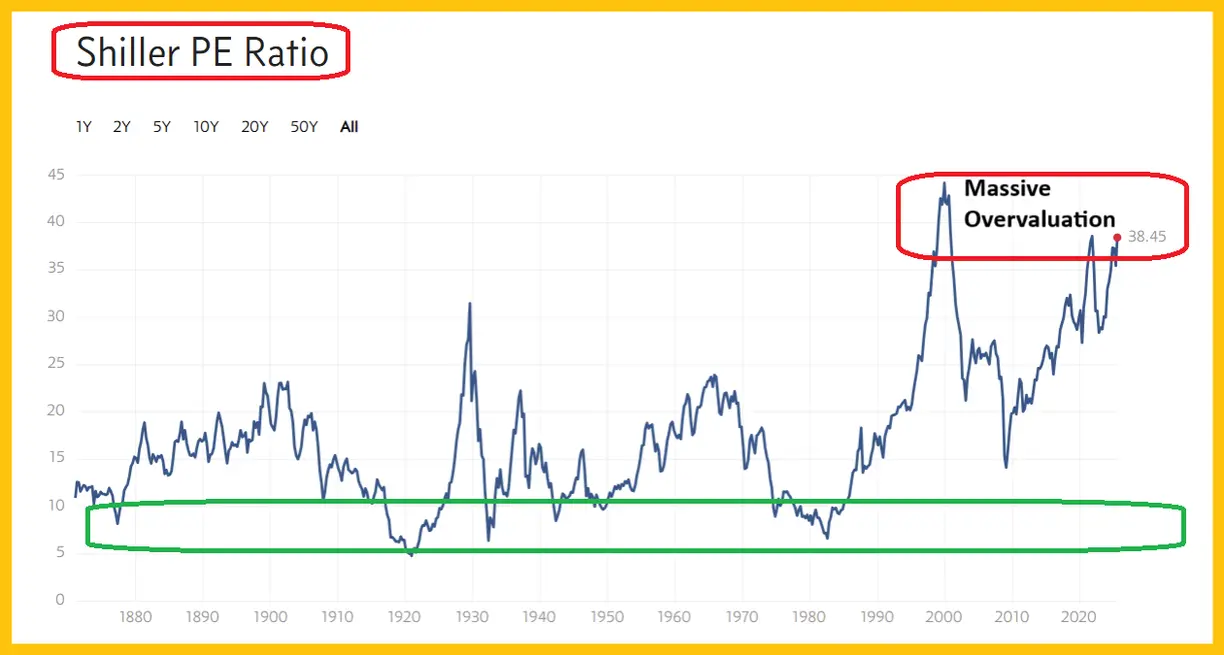
Double-click to enlarge this US stock market valuation (Shiller/CAPE ratio) chart. Clearly, investors need alternatives to this wildly overvalued market… a market that could be poised to swoon like it did in 1966 and 1929.

On that note. Double-click to enlarge what is obviously one of the most bullish charts in the history of markets, the CDNX weekly chart.

- It’s the ultimate proxy for my 40year stagflation/deflation cycle. The deflation cycle ended in the year 2020, and that was also the “final” low for the CDNX.
- Investors should experience a cornucopia of “ten bagger”(1000% gain), “one hundred bagger”, and even “one thousand bagger” moves in many CDNX component stocks as the inflation cycle intensifies in the coming years.
Double-click to enlarge this GDX daily chart. I’ve predicted a “seasonal inversion” event, where senior mining stocks surge from July to October and…

- The breakout to start the move may have occurred yesterday!
For a look at the action via the GOAU ETF. Double-click to enlarge. The technical action for GOAU is at least as good as it is for GDX.

- Note the nice position of the 14,7,7 series Stochastics oscillator at the bottom of the chart; it’s breaking above the momentum line of 50.
Double-click to enlarge this long-term US rates chart. During the last 40year inflation cycle (1940-1980) gold stocks soared as the US stock market tumbled, and vice-versa.

- Is history starting to repeat now? This appears to be the case, and August 1st could mark the next swoon for the stock market and surge for the miners.
What about silver? In an inflation cycle, silver can lead gold, and that’s certainly the case today. Double-click to enlarge. Silver has been leading gold since April and broke out of its ascending triangle at the start of June.
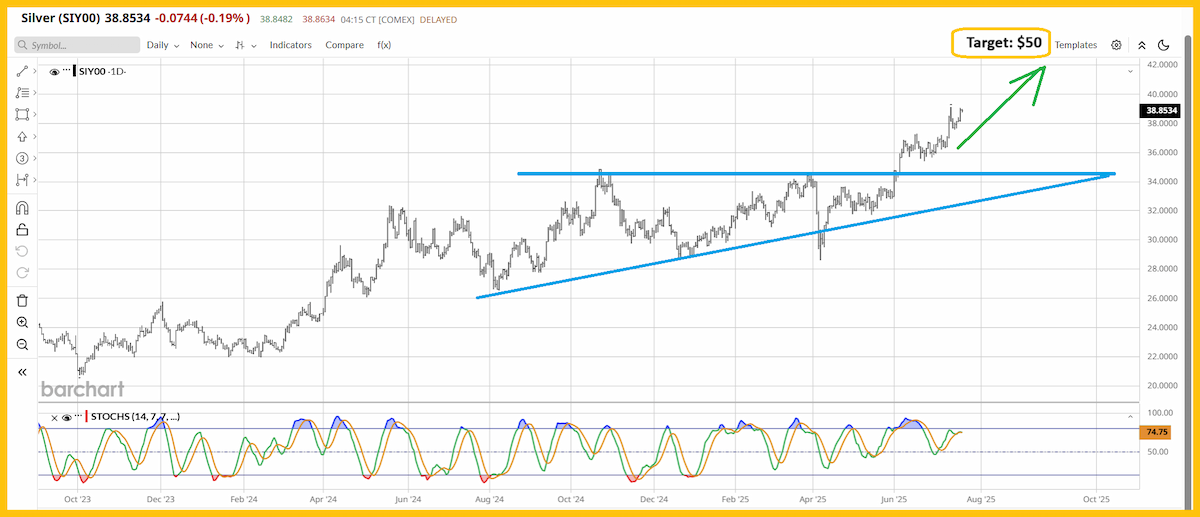
- I expect this leadership not only to continue, but to intensify.
Double-click to enlarge this stunning SIL chart. Silver stocks are breaking out of a massive 10year trading range.

- Basis the SIL ETF, the target is at least $80, and given the size of the range trade, a surge to $100 is likely! The bottom line: Good gold times and great silver times are here!