

Over $700 Million in Liquidations Led by ETH and XRP

In the past 24 hours, more than $700 million in leveraged crypto positions were wiped out, with $629 million of that coming from Longs. While Bitcoin remained relatively unaffected, the bulk of the damage came from ETH and XRP. Despite the carnage, BTC's stability reinforces that this wasn’t a BTC-led event.
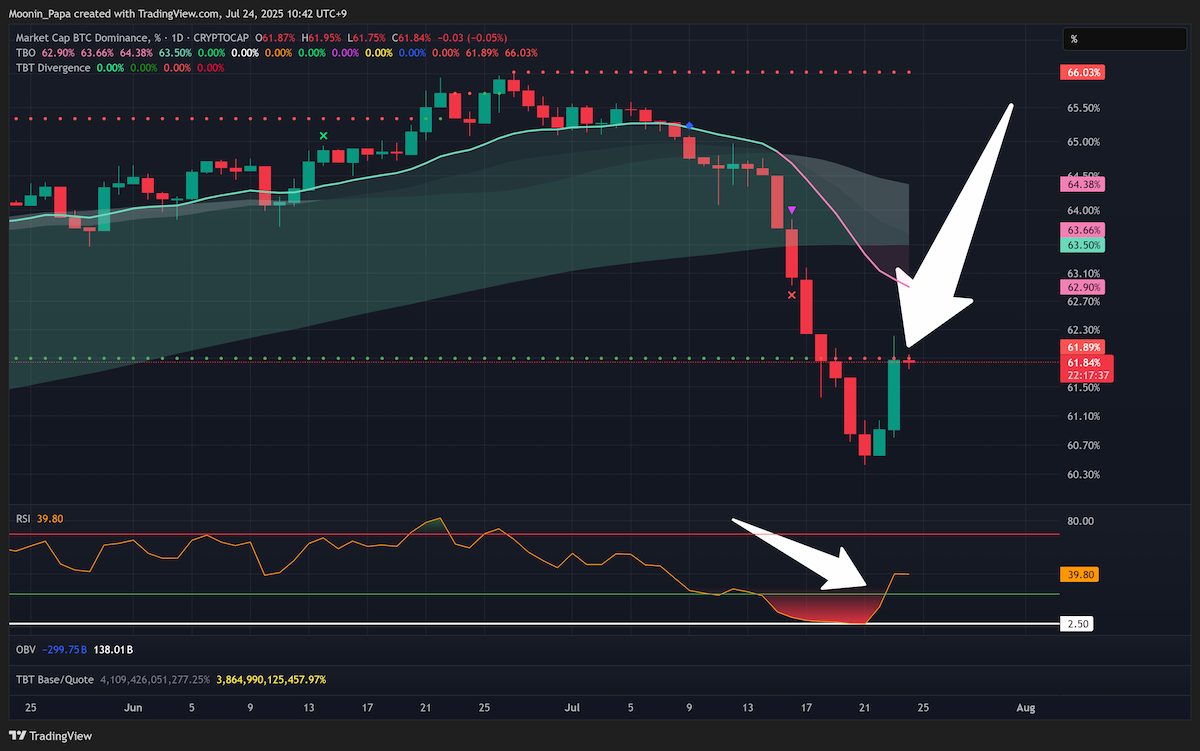
The key trigger appears to be Bitcoin Dominance (BTC.D), which ended a nine-day downtrend and surged 1.57% higher. That single chart likely sparked the cascade of liquidations, as rising BTC.D signals a shift away from alts and toward BTC. Encouragingly, BTC.D failed to reclaim its previous TBO Support and daily RSI reset from a historical low at 2.50, implying the up-move may be short-lived.

STABLE.C.D and BTC.D Suggest a Dip Buy Opportunity

Stablecoin Dominance (STABLE.C.D) printed a bullish engulfing candle yesterday, but more importantly, the TBO Slow line is curling downward — a sign of a shifting macro trend toward bearishness for stablecoins, which often precedes bullish recovery in the crypto market. As both BTC.D and STABLE.C.D begin turning bearish, the setup for a recovery in strong alts is becoming clear. Top 10 Dominance plunged nearly 8% wick to wick as a result of XRP and other major coins selling off, while OTHERS.D fell 6% in panic. Still, ETH.D only dropped 1.8% and remains strong bullish. TOTALE50.D, which tracks dominance excluding the top 50, has re-entered bearish consolidation but shows signs of macro support forming with a flattening TBO Slow line.
Top Cryptocurrencies Get Flushed

ETH, despite dropping 3% yesterday, remains firmly above the daily TBO Cloud and has strong bullish support from Volume, OBV, and a curling TBO Slow line. Its pullback from resistance around $4k was expected given the overbought RSI. XRP, however, likely led this sell-off, crashing nearly 15% and perfectly filling its fair value gap from the July 17 pump. This triggered a TBO Close Long signal and followed a TBT Bearish Divergence Cluster. While painful, these are typical reversal signs.
Select Alts Show Resilience After Pullback

BNB hit a new all-time high at $809 before failing to close above it due to the sell-off, although Volume was 4x the average. SOL lost its TBO Breakout Cluster setup but still looks promising if Volume returns. DOGE and SUI had pullbacks as well, but both are showing early signs of TBO Springboard Bounces. The SUI chart in particular reflects how charts that were previously strong often bounce from the TBO Fast line. SHIB mirrors this pattern with growing Volume and a healthy bounce setup. These Springboard Bounces typically occur because the market realizes it panic sold bullish setups, and demand quickly returns.
Not All Dips Are Worth Buying — Know the Difference

Charts like APT, which fell deep inside the daily TBO Cloud and had weak Volume before the pullback, are not ideal dip-buy candidates. Contrast that with NEAR, which wicked into the Fast line but never fell inside the Cloud, and shows consistent daily Volume growth. In panic events, the best strategy is to focus on charts that were previously strong. BONK’s resilience, shown by sustained high Volume despite a red candle, is encouraging. PENGU, which held up surprisingly well, shows that strong charts are less affected by fear-driven moves. These are the ones that often lead the market back up.
Buy the Dip — But Stay Nimble
While another pullback can’t be ruled out, the setup for a bounce is in place. TBO Springboard Bounces are excellent short-term entry opportunities, but they’re not infallible. Interruption events like this can have aftershocks. That’s why securing profits quickly and using a DCA entry strategy remains critical. With no TradFi stress, strong on-chain metrics, and select charts already rebounding, this appears to be a short-term shakeout — not a trend reversal.
For deeper strategy and the tools I use every day, visit The Complete Cryptocurrency Investor by Mastering Assets.