

TBT Bearish Divergence Prints — But Trend Context Matters

Bitcoin finally printed a confirmed TBT Bearish Divergence on the daily chart, after teasing the signal earlier in the week. This Pro-tier signal incorporates multiple indicators — not just RSI — to highlight potential turning points. However, BTC’s macro trend remains intact with strong daily Volume, a curling OBV MA, and a bullish TBO Cloud. Historical examples from late May, December 2024, and Q4 2023 show that TBT Bearish Divergences can act more as early warning signs than imminent reversal signals — especially when the TBO Slow line continues trending up. This latest signal should be noted, but not feared.

ETH and Stablecoin Dominance Charts Point Toward Recovery
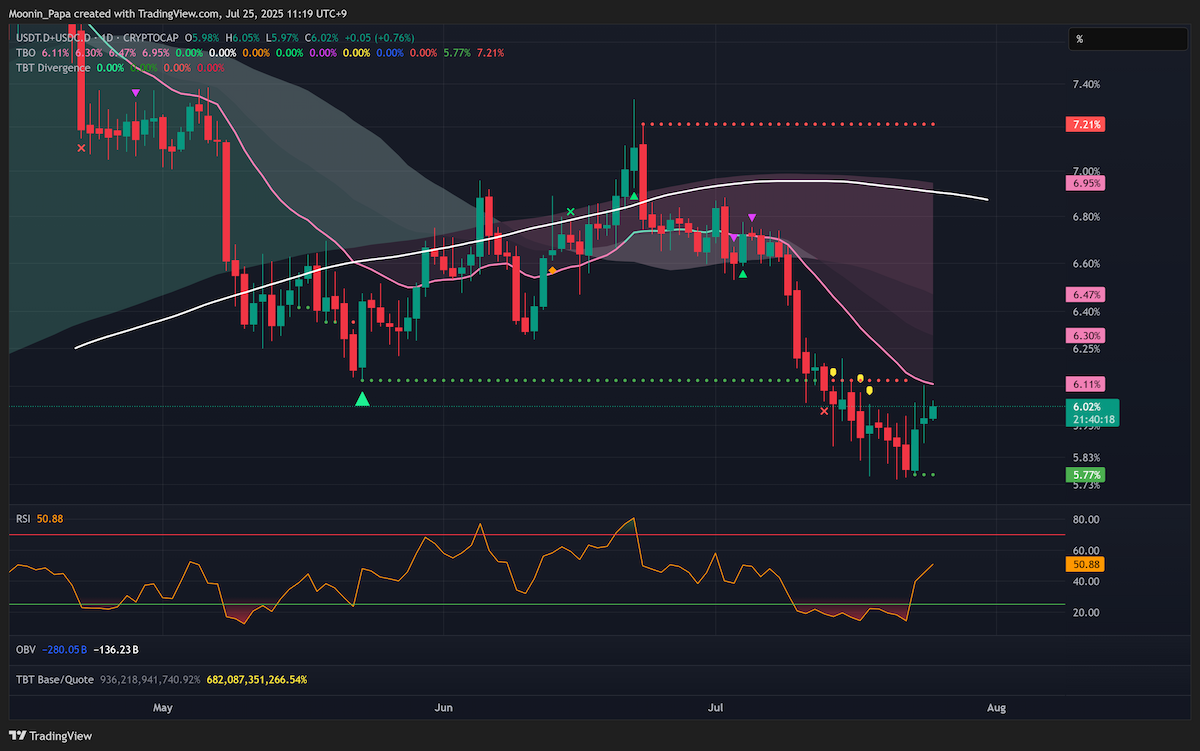
ETH remains strong bullish, closing up 2.17% yesterday even as BTC fell. Recent Divergences on ETH during its June rally preceded a drop due to a bearish Slow line, which is not the case now. STABLE.C.D remains broken on TradingView, but USDT.D + USDC.D charts confirm the macro trend is still bearish with the Slow line curling downward. Despite a recent RSI reset, this suggests stablecoin dominance should fall again soon. BTC.D also failed to reclaim TBO Resistance and has a flat Slow line — another win for ALTs.
Dominance Shifting Toward ALTs With TBO Springboard Bounces
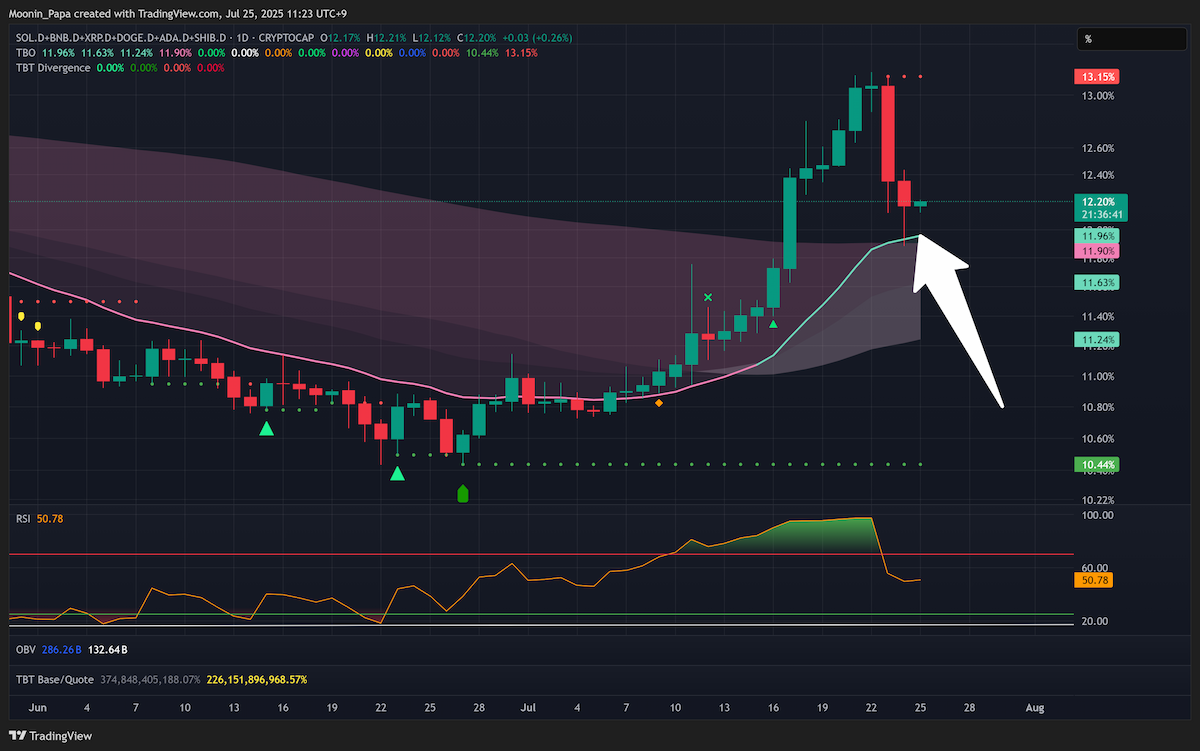
Top 10 Dominance printed a textbook TBO Springboard Bounce yesterday after tagging the Fast line — a bullish sign. Even OTHERS.D is showing signs of recovery with a bounce off the TBO Fast line and 4h RSI resets across many ALTs. This market-wide correction was sharp but short, and the Springboard setups suggest strong demand is still present. Charts that went up too fast are simply reverting to the mean.
Select ALT Charts Recovering With High Volume and Technical Strength

XRP and ADA both printed TBO Springboard Bounces with strong Volume. SUI dipped into the Cloud — less ideal — but Volume and OBV still trend up. BCH rising while BTC is red further supports a broader market recovery.
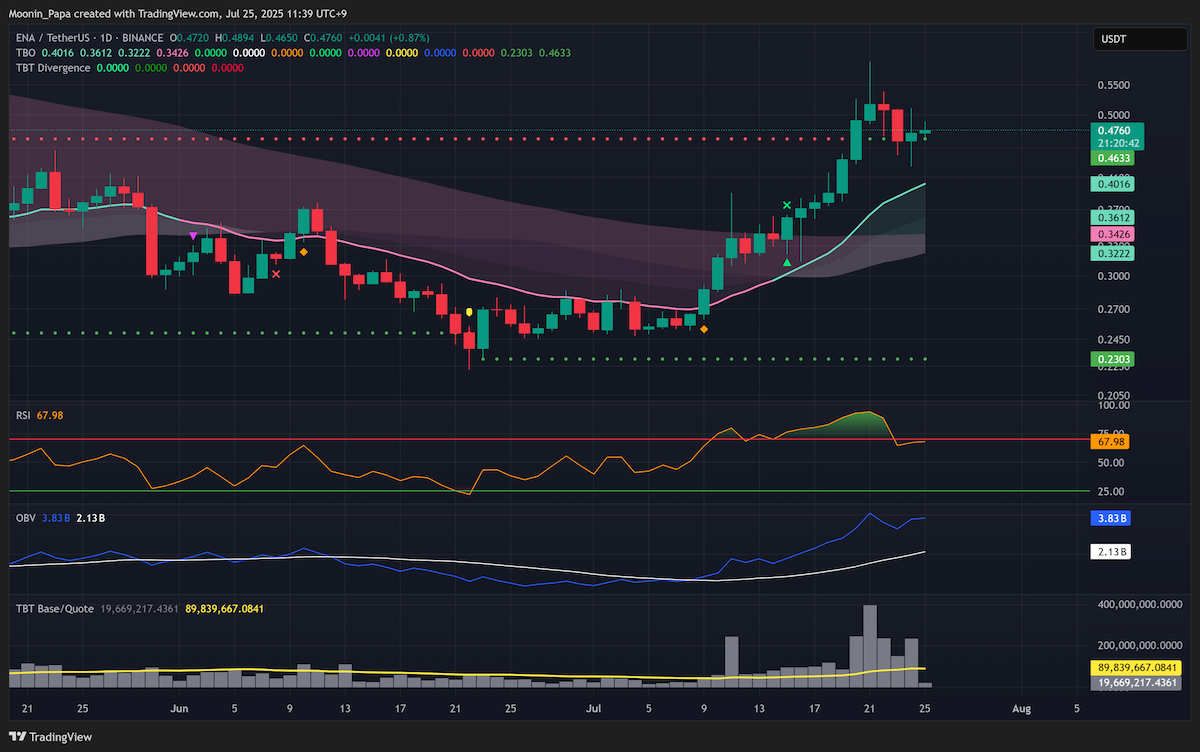
XLM, AVAX, and ENA are showing bullish closes and volume increases. Even outliers like SYRUP are pumping hard, up 24% today. HEX closed above the Cloud with an Open Long, and meme-coin status aside, may follow the market on a bullish leg. XMR and TRX also stand out for their historical tendency to perform well during uncertain conditions.
CME Gap and BTC Pullback Loom, But ALTs Look Ready
BTC still has an open CME Gap around $114k, roughly 2% below current levels. A close inside the Cloud would signal bearish consolidation, but with many ALTs oversold and printing recovery signals, the market looks poised for a bounce. Dominance charts are key here — and all signs point toward ALTs gaining traction again, even if BTC dips slightly lower.
Learn my strategies and the tools I use every day by visiting The Complete Cryptocurrency Investor by Mastering Assets.