

July Closes Strong, But Trouble Brews Beneath

Bitcoin closed July with an 8.04% gain, precisely hitting our forecasted target from the Crypto Historical Monthly Performance sheet. While that’s a clear win, the daily chart tells a more cautious story. A TBT Bearish Divergence appeared on the latest pullback, pushing BTC into the TBO Cloud—typically a signal for bearish consolidation. The drop wicked to $114k, breaking the July 25th low and opening a fair-value gap down to $111k. The only optimistic twist is the TBO Slow line’s sharp upward curl, suggesting the larger macro trend remains intact—for now.

Key Support Holds the Market's Fate

The short-term support from April 9th to June 22nd is now crucial. If BTC loses this level, a move to $111k or even $109k (historical TBO Support) is likely. But a bounce from this zone could spark a powerful short squeeze, pushing BTC toward $139k. It's a true inflection point. ETH is showing relative strength, still well above its TBO Fast line.

The ETH/BTC chart is especially important—if ETH can close above the 0.382 Fib level, it could ignite a broad ALT rally. However, that resistance has proven tough to break.
Stablecoin Dominance Sends a Warning

A confirmed TBT Bullish Divergence appeared on the stablecoin dominance chart, hinting at increasing stablecoin inflows—a historically bearish sign for crypto. For this signal to be invalidated, stablecoin dominance needs to fall below 5.79%. BTC Dominance (BTC.D) has moved slightly higher, but no bullish divergences have printed, and it remains below major resistance. TOTALES also printed a bearish divergence, but the ascending TBO Slow line and rising volume suggest more strength than in previous pullbacks.
Macro Forces Add Complexity

The DXY continues climbing with daily RSI reaching 80.13, nearing December highs. More importantly, the weekly chart is now forming a TBT Bullish Divergence for the first time since March 2021—just before the last major dollar rally. Historically, this coincided with big moves in the S&P and BTC.

If this pattern repeats, the S&P could climb another 33% by the end of 2026, with Bitcoin potentially extending its bull cycle beyond the expected November 2025 top. While speculative, this alignment of macro signals can’t be ignored.
ALTs Mixed as Market Teeters
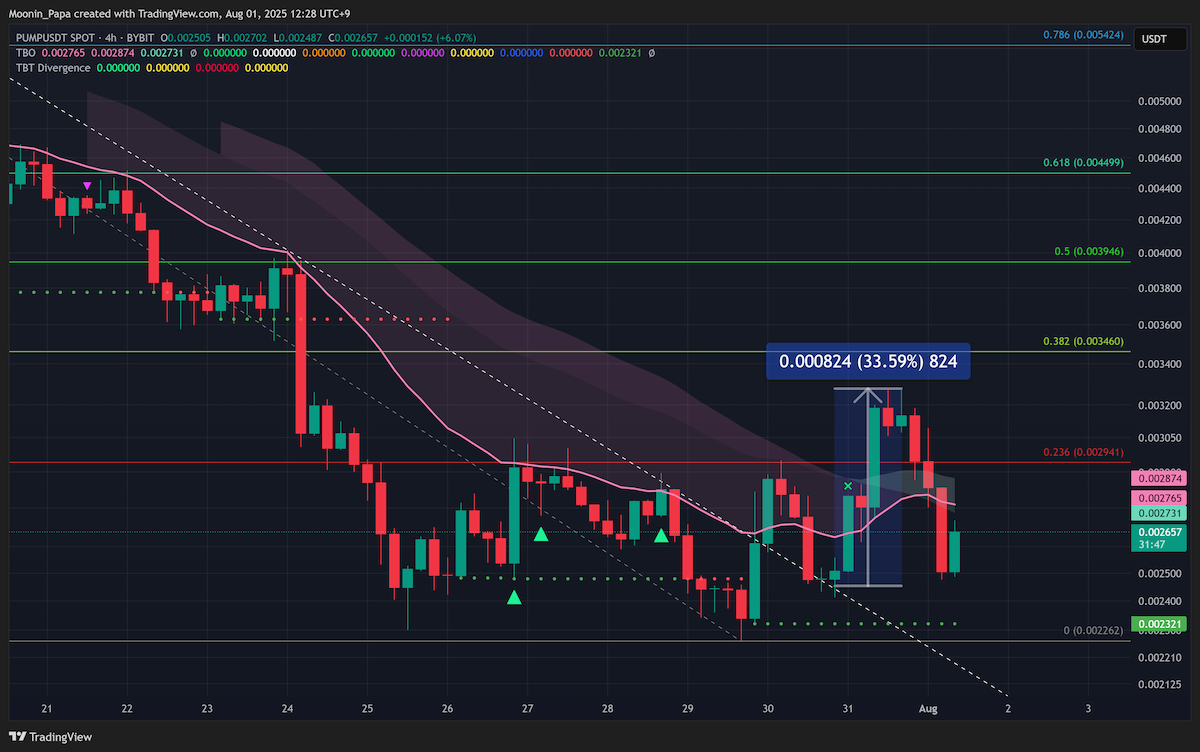
Across the ALT market, we’re seeing mixed signals. XRP, SOL, and SUI are deep in bearish consolidation. BNB remains strong above its Cloud, but others like DOGE and AAVE are showing early signs of RSI resets. Charts like ENA and PUMP are defying broader weakness, but the overall picture is shaky. Some coins are clinging to support, while others are already fading below key levels. It’s a make-or-break moment across the board.
Trading Plans Matter Most Right Now
Whether BTC bounces or breaks, the volatility will be intense. These setups often bring frustration or panic—but also opportunity. Pullbacks create the space for dip buys and springboard bounces. Stick to your strategy, manage risk, and don’t rely on speculation alone.
Learn my strategies and the tools I use every day by visiting The Complete Cryptocurrency Investor by Mastering Assets.