

Bitcoin and Ethereum Technical Outlook

Bitcoin recorded a marginally higher high midweek, lifting the daily RSI but aligning with a bear flag setup. A pullback is anticipated, with RSI expected to decline and establish a pivot high. The 4-hour TBO Open Long confirmation acts as a reset, followed by likely TBO Close Long and breakdown signals, suggesting further downside ahead unless key support is reclaimed.
Ethereum remains range-bound with stalling price action and shrinking volume on the daily chart, characteristics typically preceding a bearish move. The slightly higher Wednesday RSI failed to sustain, and a break below support could drive ETH to a lower low. Despite a potential daily TBO Open Long on ETH/BTC, conviction remains low amid broader market weakness.
Crypto Market Structure and Dominance Metrics

Combined stablecoin dominance is consolidating bearishly within the daily TBO Cloud, with the RSI hinting at a higher low. A sharper Bitcoin decline could trigger a dominance surge and RSI higher high, yet a bearish response is awaited. The TOTALE100 chart has been strong bearish since exiting the daily Cloud nine days ago, and a close below the parallel channel at 2.02T would confirm a bear flag breakout and signal a potential capitulation low.
Similarly, TOTALE50 exhibits a pivot-high reversal pattern, while TOTALES is poised for a breakdown. Collectively, these metrics affirm a broad bearish bias across total crypto market capitalization.

Traditional Finance and Macro Indicators
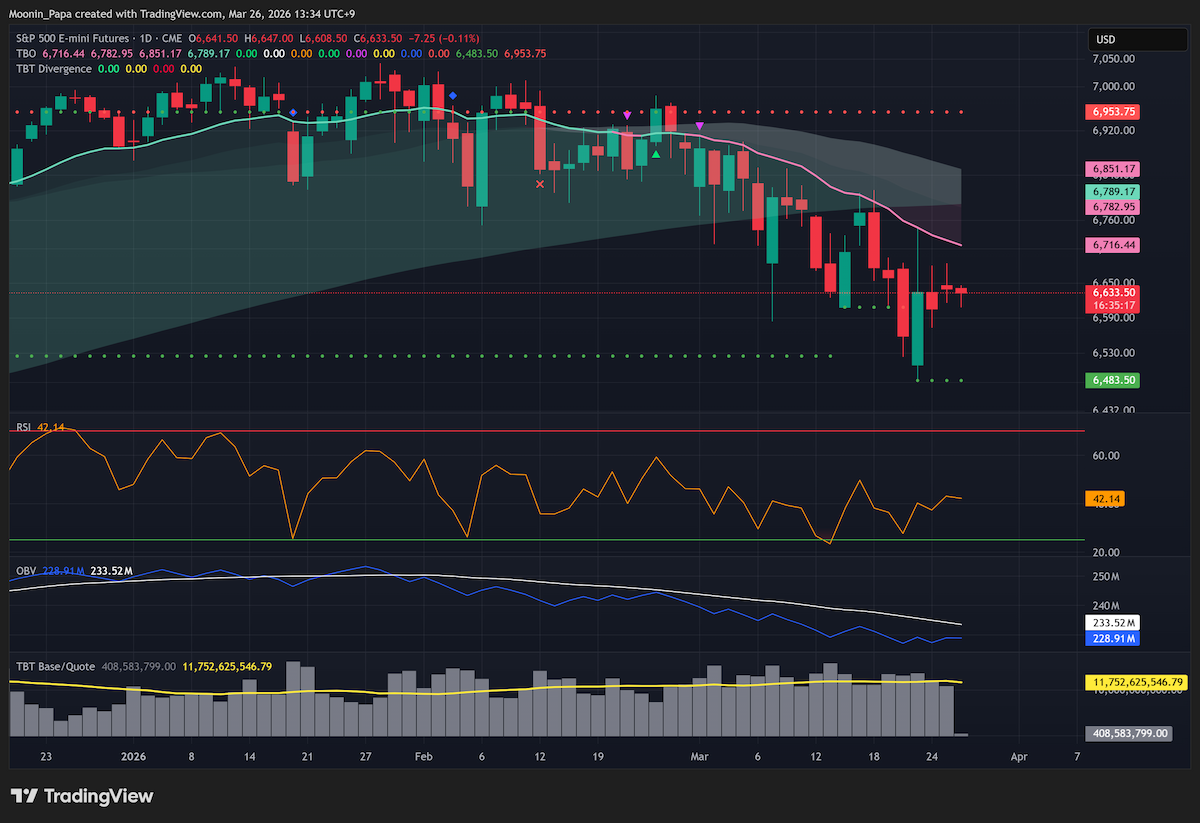
The US Dollar Index posted a 0.46% gain, retaining “strong bullish” status above the daily TBO Cloud, though multiple Cloud intrusions suggest further choppy price action. USD/JPY’s ascent intensifies risks for global markets, with the 160 level looming as a critical resistance. S&P 500 futures and the Dow Jones Industrial Average remain in “strong bearish” mode below their Clouds, corroborated by declining on-balance volume and bearish moving averages, while the Nasdaq and FANG index display similar weakness. The VIX persists in a high-volatility rejection zone.
Asia-Pacific equities show mixed signals: the Nikkei’s tag of its daily TBO Fast line precedes a likely setback, Shanghai’s open gap warrants caution, and the Hang Seng has begun pivoting lower as its OBV moving average turns downward.
Commodities and Gold-Bitcoin Dynamics

UK Oil’s wick into the daily TBO Cloud suggests a potential drop into the Cloud, with a neutral RSI at 50 indicating waning bullish momentum. Gold’s RSI failed to confirm a bullish reset, closing below 25, and on-balance volume trends point to bearish pressure. A lower bounce may occur, favoring dollar-cost averaging over outright entries. Silver reached the 1.272 Fibonacci extension but did not close above it, while platinum remains in bearish consolidation with weak volume. Copper’s TBO Close Long signals choppiness rather than strength, and uranium, despite a recent TBO Open Short, is rebounding toward resistance within a parallel channel.
Notably, PAXG/BTC charts show hidden bullish divergence with rising RSI and falling price, indicating gold may outperform Bitcoin on a relative basis even if both underperform in absolute terms.
Altcoin Market Highlights
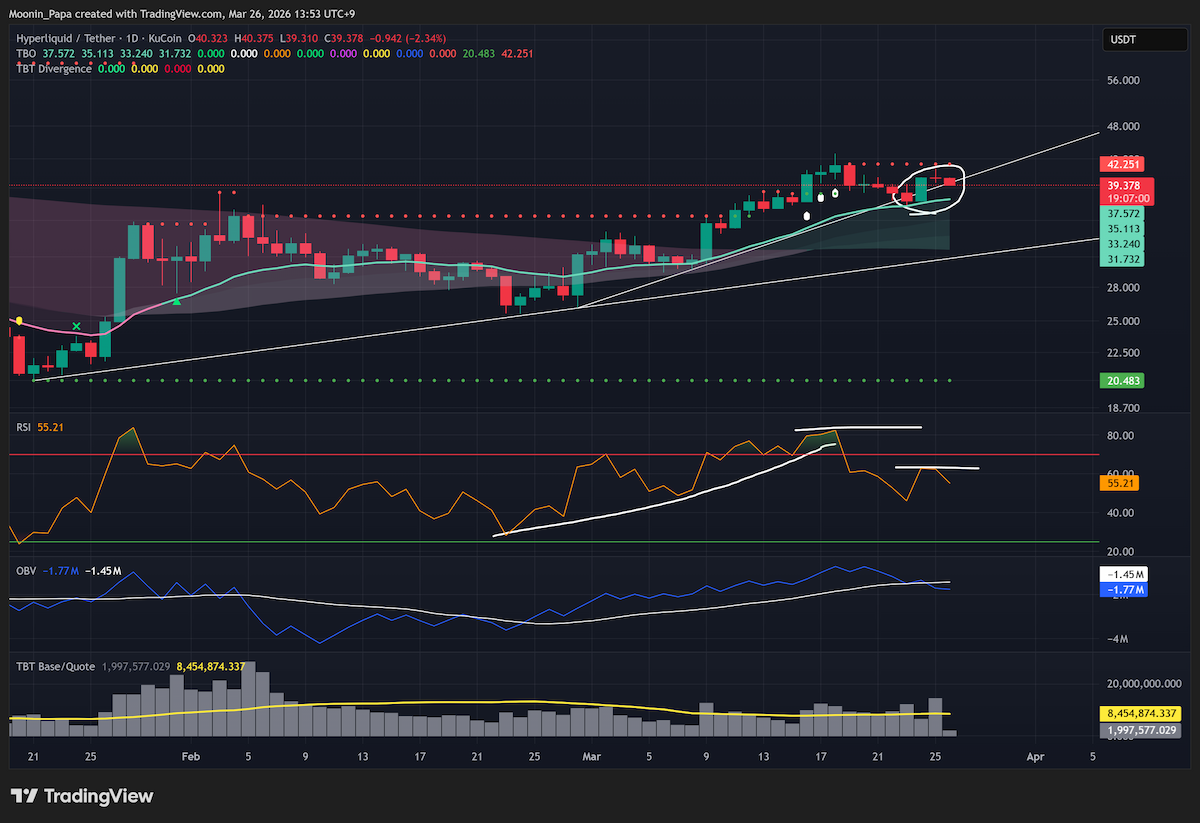
Altcoins present divergent setups: overbought coins risk sharp reversals, while strongly bearish charts may trigger stop-out cascades. SOL struggles to reclaim lost support, XLM and HYPE feature bearish RSI divergences, and DOT approaches daily TBO support. Historical resistance challenges M, and TAO, despite bullish momentum, appears ready for a pivot high. ASTER’s long lower wicks expose downside potential, while APT, RENDER, and ATOM reflect ongoing breakdown patterns. QNT and the TRUMP token show high-risk short setups, and projects such as FET, OP, RIVER, BAT, MON, ZRO, IMX, FLUID, and ZBCN all demonstrate volume declines and stalling price action consistent with bearish pressures.
Learn my strategies and the tools I use every day by visiting The Complete Cryptocurrency Investor by Mastering Assets