

Bitcoin Technical Outlook
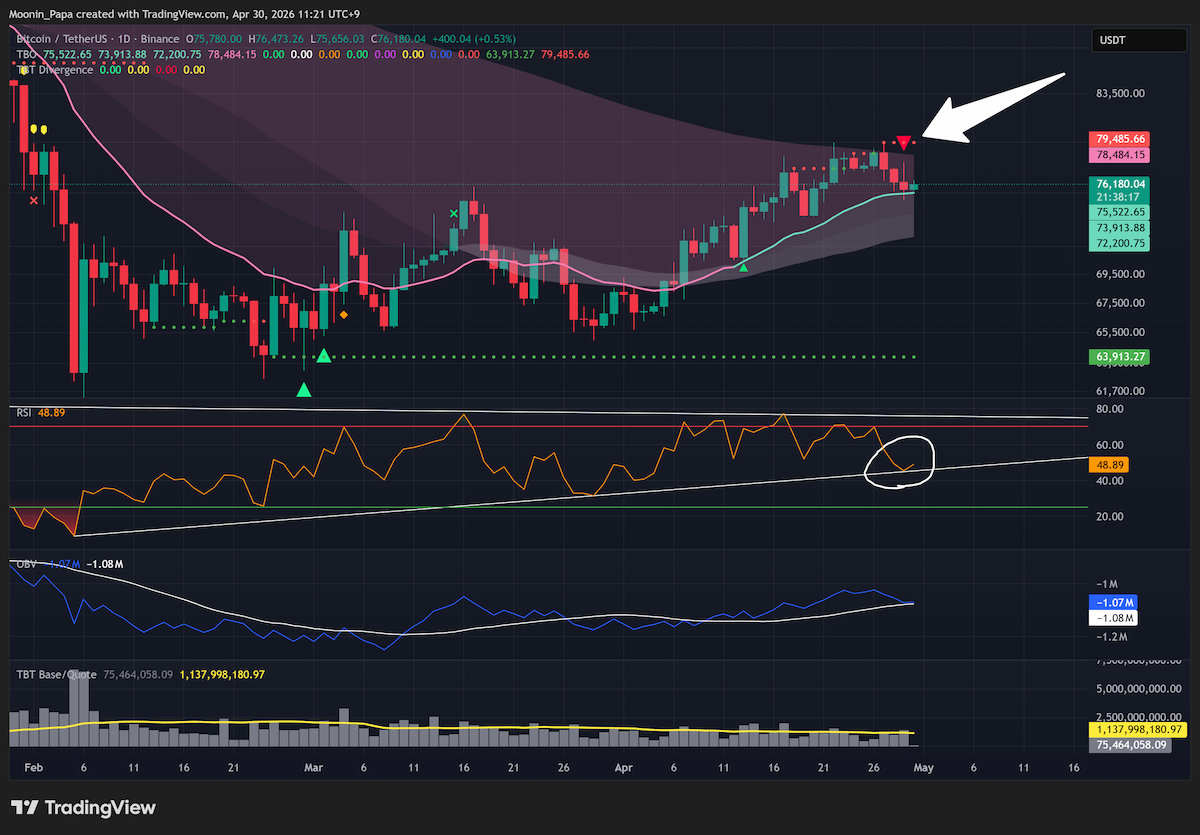
Bitcoin has retraced approximately 52% from its October peak to February’s low, piercing the top of the daily TBO Cloud and triggering a TBT bearish divergence reminiscent of the 2022 collapse (–59% over 72 days). With digital-asset treasuries facing potential margin calls, the sell-off risk intensifies as leveraged funds liquidate positions, accelerating downward momentum.
Key catalysts include outsized buying commitments from institutional figures, yet historical patterns suggest a hard red line that cannot be crossed without severe repercussions. If 2022’s playbook repeats, a major collapse could unfold over the next two months—hence the two open short positions targeting further declines.
Ethereum and Stablecoin Dynamics
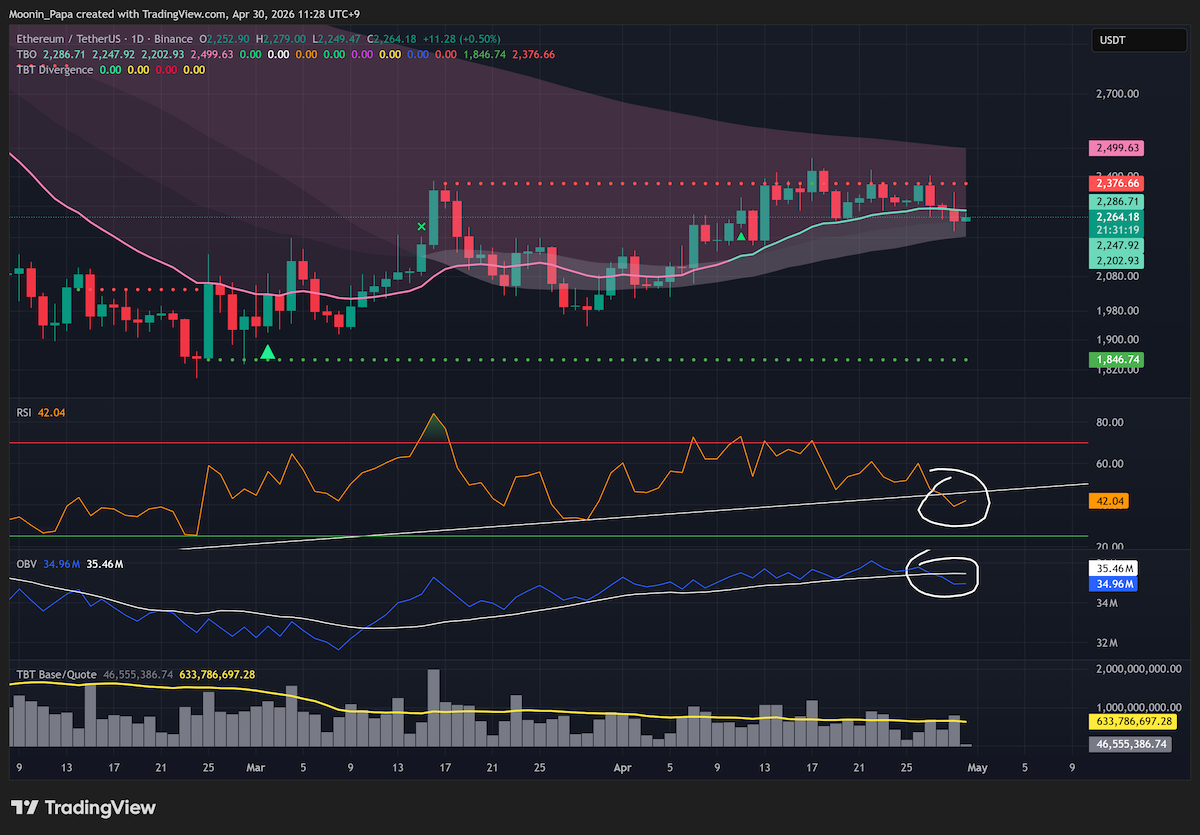
Ethereum continues to struggle below daily TBO resistance, having failed three times in as many weeks. Daily RSI has closed well below its support level, and OBV has crossed beneath its moving average, setting the stage for a return to “strong bearish” mode beneath the TBO Cloud.
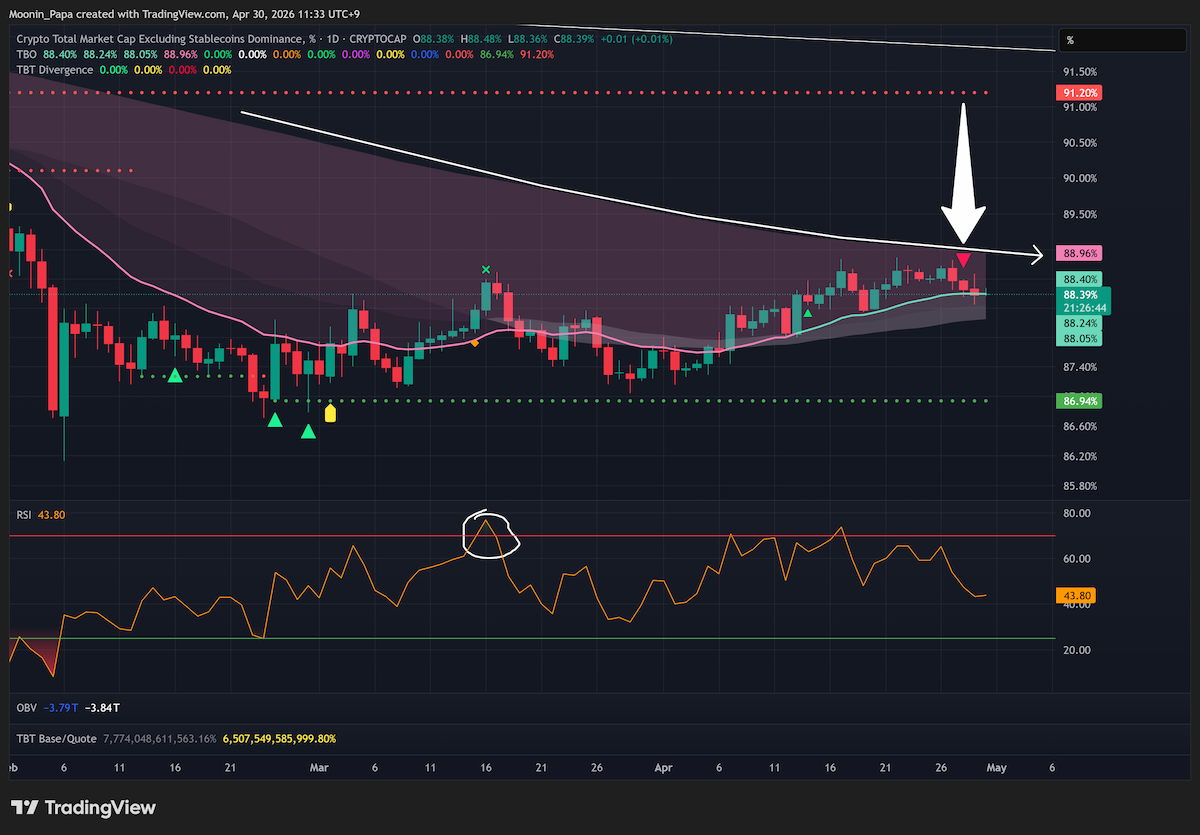
Combined stablecoin dominance printed a TBT bullish divergence earlier in the week and closed above the daily TBO fast line on Wednesday, with RSI making a higher high. Should this trend persist, it would signal a broad bearish reversal as traders rotate into fiat alternatives.
Market Dominance and Altcoin Capital Flows
Bitcoin dominance (BTC.D) hovers around 60.4%, exhibiting a bearish divergence as price posts higher highs while RSI makes lower highs. Ethereum dominance (ETH.D) remains decisively bearish below its daily TBO Cloud, and “Others” dominance is similarly weak with a likely floor near 6.48%.
Total crypto market cap dominance (TOTALES.D) confirmed a TBT bearish divergence on Tuesday; OBV now trades below its MA and RSI has broken mid-term support. By contrast, the Total Ex-Top-100 index (TOTALE100.D) may see intermittent strength as micro-caps decouple, though such moves are expected to be outliers amid a broad downtrend.

Traditional Finance Indicators
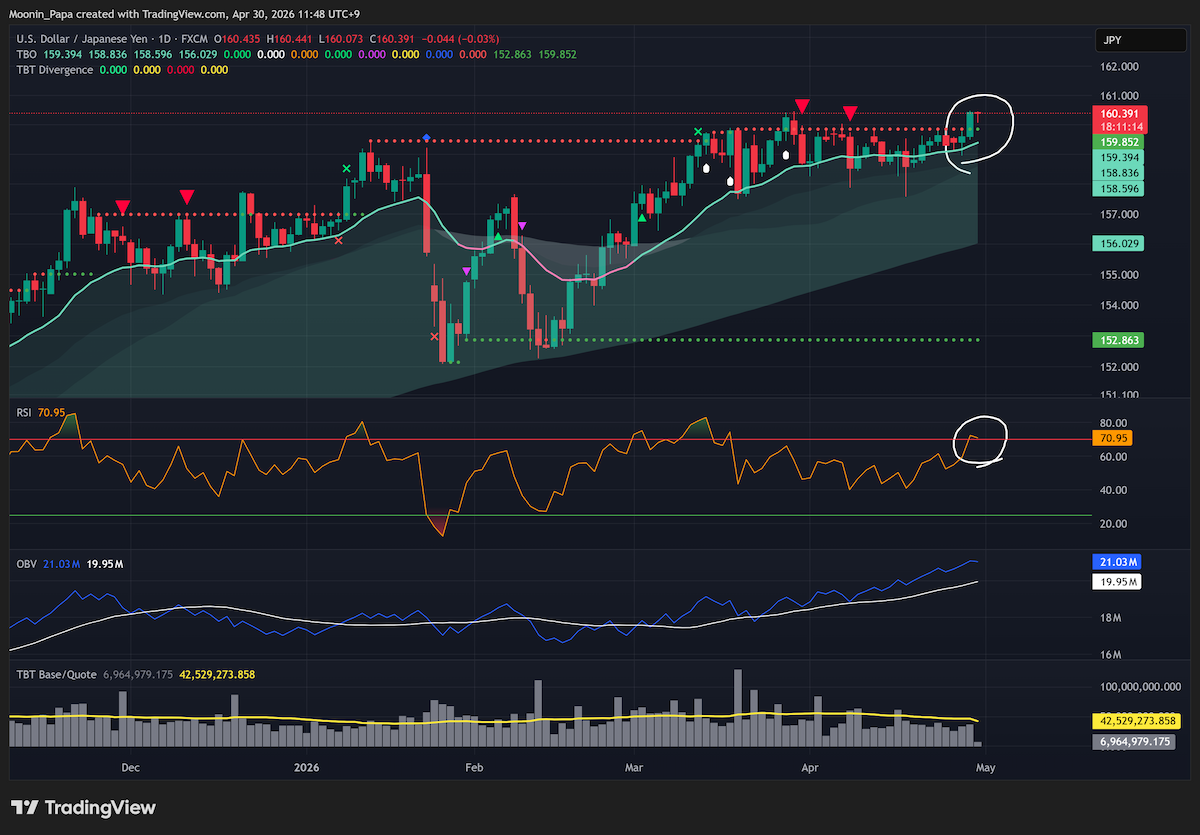
The US dollar index (DXY) has risen for two consecutive days above short-term resistance, leaving a gap at 99.516 to be filled. EURUSD is correcting lower in sympathy, while USDJPY reached 160.473 and entered overbought territory (daily RSI 72.36), approaching escape velocity that may force Bank of Japan intervention as in July 2024.
US equity futures are mixed: S&P 500 futures gap fills remain outstanding, DJI nearly filled its first gap, and NDX retains three open gaps. Sector rotation is evident as FANG stagnates with falling RSI, while NVDA remains technically bullish yet carries two lower open gaps. The Nikkei shows a bearish divergence cluster on its weekly chart and lower highs in RSI, suggesting further downside risk.
Commodities: Oil, Gold, and Precious Metals
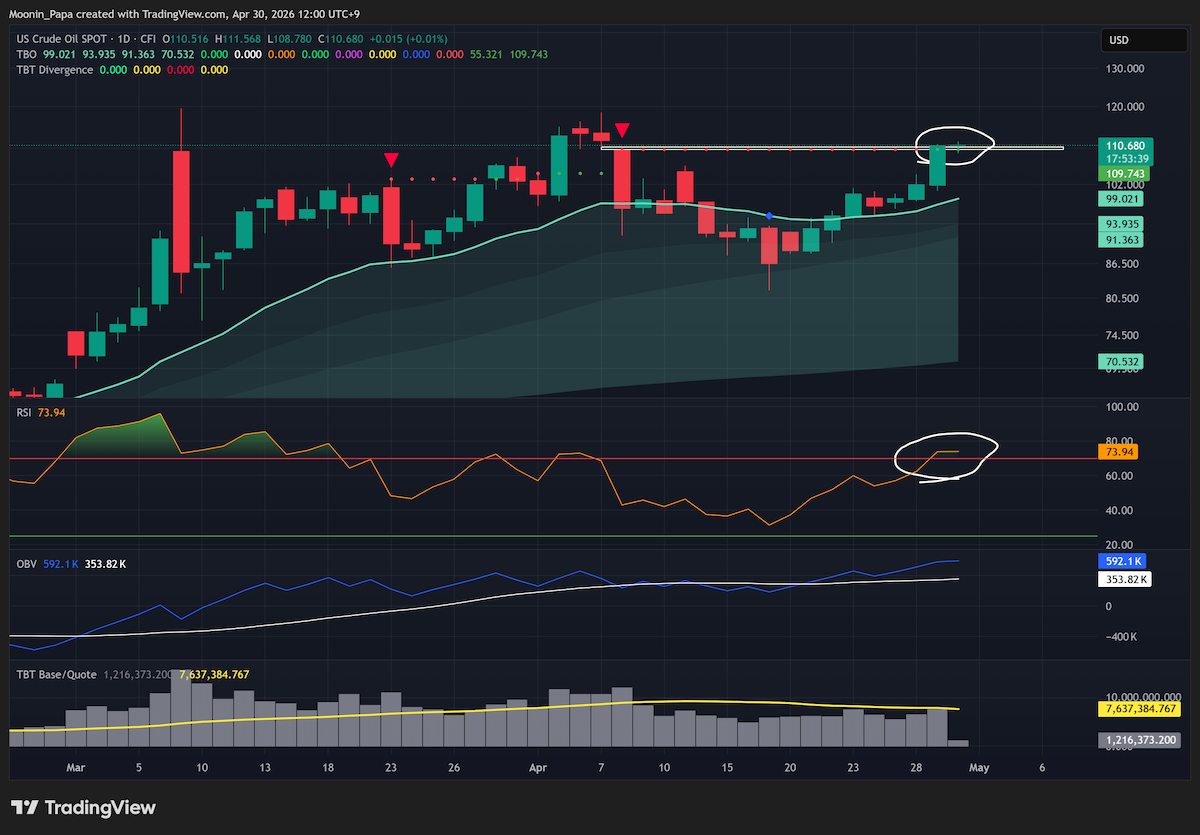
WTI crude oil finally closed its upper gap above $110, with daily RSI overbought. This presents an optimal shorting opportunity targeting the TBO fast line near $99. Gold reached the TBO slow line on Wednesday, saw a slight RSI overshoot, and is likely to stage a bullish RSI reset and short-term bounce; silver is expected to follow.
Platinum has printed a bullish RSI reset and may push back above its daily TBO Cloud, whereas uranium has fallen back inside its bull flag with no clear signs of renewed strength.
Altcoin Risk Assessment
Major altcoins exhibit elevated risk profiles. XRP confirmed a TBO open short on Wednesday and is poised for a TBO breakdown cluster on the next leg down. ZEC and M are consolidating bearishly within their daily Clouds, though M could see a short-squeeze retest of resistance near 4.39 before resuming its decline.
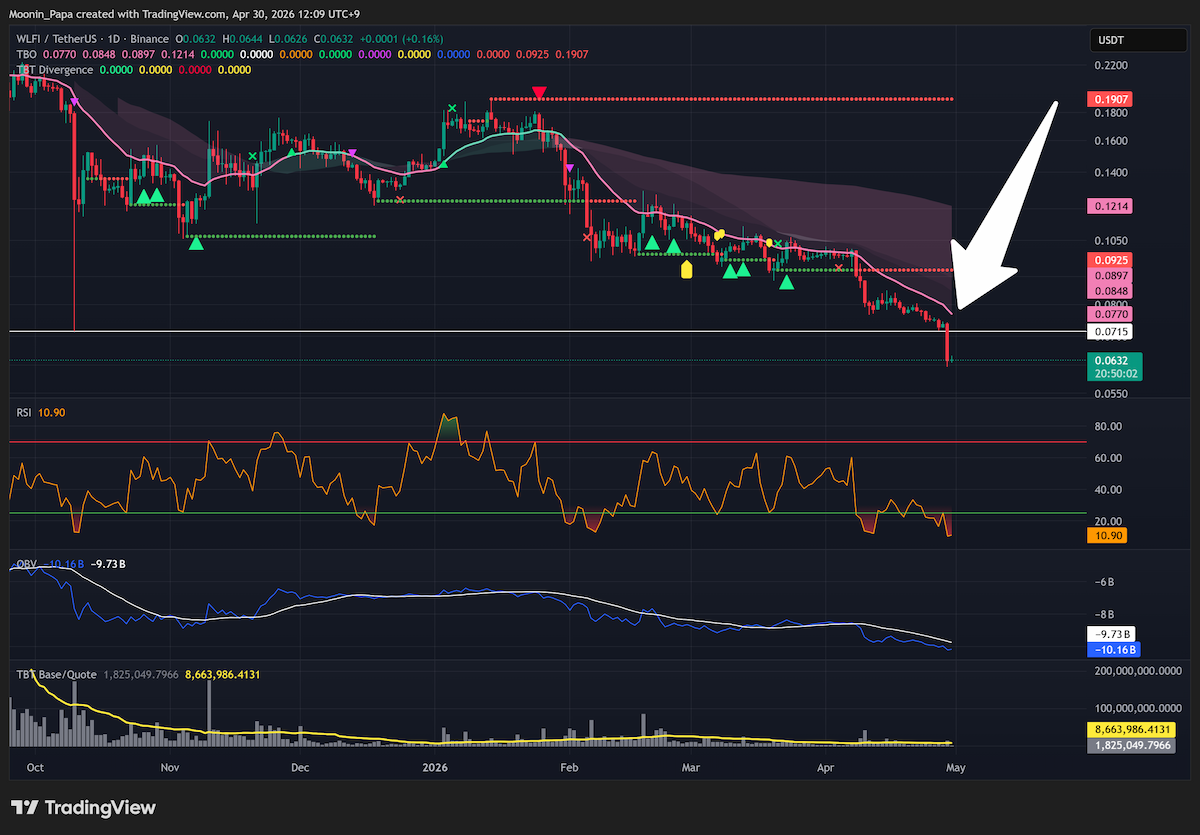
Deep dumps in positions such as WLFI (–14%) may provoke short-squeeze bounces, but the prevailing bias remains lower. Tokens including NEAR, SKY and MORPHO are either breaking support or failing at resistance, underscoring a cautious approach amid broad market weakness.
Learn my strategies and the tools I use every day by visiting The Complete Cryptocurrency Investor by Mastering Assets.