
The setup for gold heading into the second half of 2026 looks constructive, even as the metal works through near-term pressure. The conflict in the Middle East has stoked rising inflation concerns, boosting expectations that the Federal Reserve could deliver at least one rate hike by the end of the year. Wednesday's June FOMC minutes reinforced the case, with nine of eighteen policymakers seeing at least one hike by December, and highlighted upside risks to inflation. Yet soft June payrolls argue for patience even as the 10-year Treasury yield touched a seven-week high near 4.60%. We believe next week's July 14 CPI should indicate easing inflation and may mark the first step toward building a low.
Daily Gold Chart
Nowcasting models, including the Cleveland Fed's, point to headline inflation decelerating from May's 4.2% pace as oil prices normalized through June, so that the report may cool the narrative around a hike.
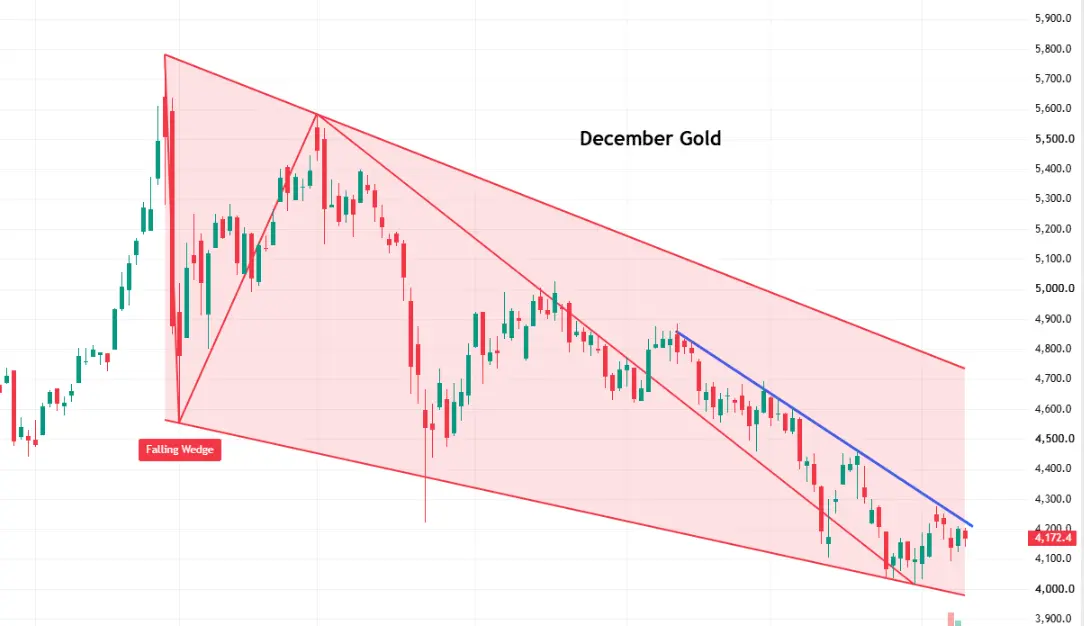
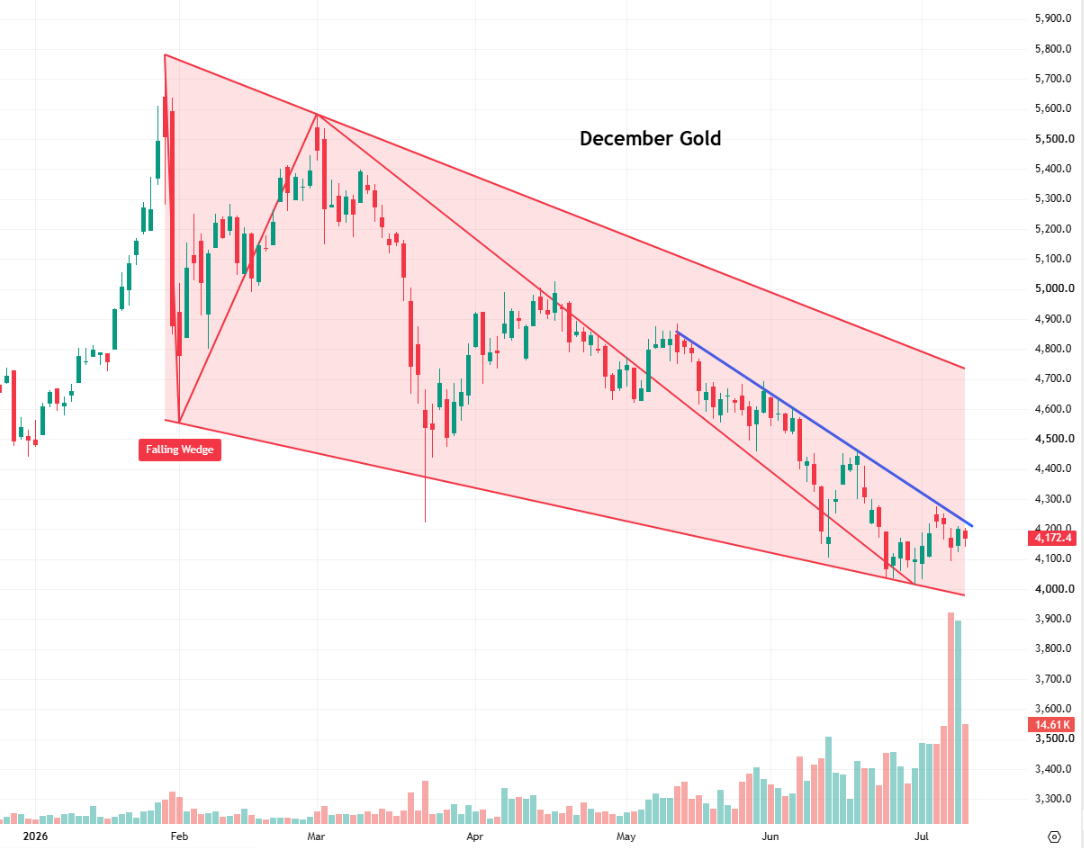
On the technical side, the level we are monitoring on the upside is the downward-sloping trendline in place since last February, connecting a series of lower highs and coming in near $4,200. A breakout above that trendline could spark a sudden move to $4,700, the top of the falling wedge pattern, and ultimately $5,000. On the downside, initial support sits at $3,950 and $3,900, levels that would need to hold to keep the constructive structure intact.
Several forces support the constructive view. Normalization in the Strait of Hormuz should, over time, cap the inflation impulse driving the hawkish repricing, and we expect the market to scale back rate hike expectations as that plays out. Our base case is one-and-done rather than a hiking cycle. We also expect central bank purchases to return in time, and retail investors, often late to the game, should drive ETF inflows once traders get confirmation that the Fed is at the end of the cycle. Adding to the case, gold has historically shown seasonal strength through July and August, with the 15-year pattern tending to firm from early July toward a late-summer peak, arriving just as price tests major support.
From here, we see two scenarios. A perpetually hawkish Fed, combined with ongoing rhetoric in the Middle East, could keep gold range-bound between $4,000 and $4,400. But once the market moves past rate hikes, $5,000 is likely the next destination. With seasonal tailwinds building, the structural bid intact, and the catalyst calendar turning, this is where it becomes a matter of time in the market, not necessarily of timing the market.
Example 10 oz Gold Strategy
For traders looking to put that long game into practice, here is one example of how a position could be structured. Historical trends indicate a pattern of seasonal strength in buying December Gold from early July and selling near the end of August over the past 15 years. In light of this, we work through an example trade idea: buying one December Micro Gold contract (10 oz), where each $1 move equals $10 in profit or loss. The entry point is $4,150, with a stop at $3,900, for a risk of $2,500. The initial target is $4,700, as breaking through that level could pave the way to $5,000 by year-end, for a potential reward of $5,500.
We map these levels and setups every Sunday in our Navigating the Week Ahead newsletter, covering the calendar, the charts, and the key levels before the week opens. You can sign up here at "Navigating the Week Ahead."
Performance Disclaimer
Hypothetical performance results have many inherent limitations, some of which are described below. No representation is being made that any account will or is likely to achieve profits or losses similar to those shown. In fact, there are frequently sharp differences between hypothetical performance results and the actual results subsequently achieved by any particular trading program.
One of the limitations of hypothetical performance results is that they are generally prepared with the benefit of hindsight. In addition, hypothetical trading does not involve financial risk, and no hypothetical trading record can completely account for the impact of financial risk in actual trading.
For example, the ability to withstand losses or to adhere to a particular trading program in spite of trading losses are material points that can also adversely affect actual trading results. There are numerous other factors related to the markets in general or to the implementation of any specific trading program that cannot be fully accounted for in the preparation of hypothetical performance results all of which can adversely affect actual trading results.
