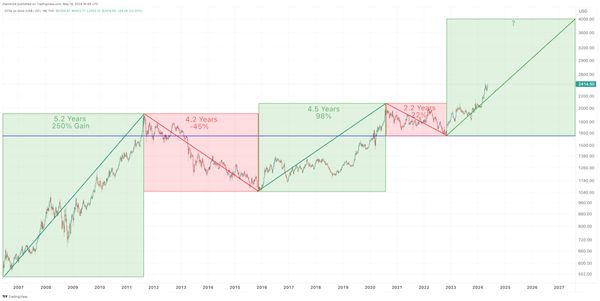
The gold price bottomed in late 2015 around $1,050 per ounce. It shot 30% higher in 2016 to $1,375 and then chopped mostly sideways for three years. Then in June of 2019, the price spiked powerfully higher from $1,300 to a new record high at $2,070, a move of 60% in the course of two years. Investors were optimistic that a new bull market cycle was underway. But the price crashed back toward $1,600 over the next six months.
Another move to test record highs occurred in May of 2023 and failed with a drop back to $1,800. Yet another attempt in December of 2023 succeeded with a quick spike to $2,150. After chopping around $2,000 per ounce, gold made another powerful bounce to a new record high last month around $2,430, a move of over 40% in just a few months.
The price is currently trading around $2,415 and gold looks poised to once again make a new high. It would only take a 24% move this time around for gold to breach $3,000 and I believe it is coming sooner than most people think.
The chart shows the past two major bull and bear cycles. Taking the average of time and percentage gain between these two bull cycles, we might expect the current bull cycle to last for 4.9 years and generate a gain of 175%. That would translate into a bull cycle that runs into the back half of 2027 and brings a peak price around $4,440 per ounce. But even if the price advance were to only mirror the smaller of the last two bull cycles (98% gain), we get a peak price around $3,230 per ounce. Given the factors discussed below, I think gold is more likely to hit the higher of the two price targets, but anything is possible as the fractional reserve fiat currency model is stress tested.
4 Major Catalysts that Will Push the Gold Price Above $3,000
While there are several factors that I believe will push gold above $3,000 per ounce over the next few years, I will focus on the three main catalysts driving the price gains.
- Rapidly Increasing Debt / Declining Fiat Currency Values - The national debt is quickly approaching $35 trillion in the United States and is growing by $1 trillion every 100 days! There is a record amount of credit card debt, now over $1.1 trillion with the delinquency rates more than doubling over the past few years. Between credit card debt, home equity debt and auto debt, consumers in the U.S. have amassed $3.4 trillion in new debt since the pandemic. The M2 money supply spiked from $15 trillion before Covid to over $20 trillion currently by 2022. That is a 33% jump in a few years. Put another way, around 25% of all dollars in existence since the Federal Reserve started printing them over 100 years ago were created in just two years following Covid. While the money supply did contract for about a year starting in the spring of 2022, it has flatlined in the past year and started growing again in recent months. With the Fed expected to start cutting rates again, this is only going to lead to more money creation as a time when de-dollarization is accelerating globally. This will all translate into a weaker dollar and much higher prices for scarce physical goods such as gold.
- Strong Gold Demand Fundamentals - When factoring in demand from the OTC markets and other sources, total gold demand climbed to a new annual record at 4,899t in 2023. There are no signs of this demand slowing in Q1 of 2024, as total gold demand increased 3% y/y to 1,238t – the strongest first quarter since 2016. Central bank gold buying remained robust at 290t (net). Bar and coin demand enjoyed a 3% y/y increase. Central banks around the globe are purchasing record amounts of gold as they sell record amounts of dollar-denominated Treasuries. China and Turkey have been the largest buyers and massively under-report their true purchases. When the WGC estimates un-reported purchases via trade data and private sources, they report that net gold purchases have more than doubled from a decade ago.
- Lack of Supply Growth - While the headlines report that total supply increased 3% in 2023 year or year, this was almost entirely driven by recycling. Mine production was only up 1% in 2023 and I think the more important supply metric to monitor is total gold contained in initial resources. This number declined in 2023 to a four-year low of 37.1 million ounces, 7% lower than the 40 Moz announced in 2022. The number of gold initial resource announcements increased to a five-year high of 56. Yet only 30% contained more than 500,000 ounces of gold, decreasing the average to 0.7 Moz from 0.8 Moz in 2022. This marks the second consecutive year of decline for gold in initial resources, weighed down by reduced financings, exploration budgets and drilling activity. Put simply, the gold price has not kept pace with rapidly rising costs for miners over the past decade and this had led to reduced exploration budgets. The recent surge in the gold price will change that, but it still takes years to bring new projects online, so little supply growth is expected over the next few years.
- Rising Geopolitical Tensions - There are major flashpoints and wars being waged by nuclear powers at the moment, unfortunately. NATO is fighting a proxy war against Russia in Ukraine and Israel is fighting against multiple countries in the Middle East. Either of these wars could easily draw in more nations, engulf their respective regions and spiral out of control quickly. The potential of nuclear war is perhaps at the most elevated levels since the Cuban Missile Crisis and there does not seem to be much effort toward de-escalation, diplomacy, or negotiations toward peace. While I'd rather the gold price be rising for different reasons, geopolitical instability and uncertainty are driving capital toward safe havens and I don't expect this trend to end anytime soon.
While I always advocate for holding some physical gold in your possession, I think we have recently entered the part of the bull cycle where gold mining stocks outperform gold itself. While gold is up 1.3% in the past month, the VanEck Gold Miners ETF (GDX) is up 9% and the VanEck Junior Gold Miners ETF (GDXJ) is up 10%. Looking at a longer time period, gold is up 20% in the past 3 months and GDX is up 37%. The leveraged gains have been accelerating over the past month or two.