

On the heels of last week’s piece “Another Gold Pop n’ Flop”, now we’ve “Gold Gets Gut-Punched … Again” But be thee not at ends, dear friends. For as we’ll herein see, Gold’s weekly parabolic trend remains Long, which reinforces our “buy on the dip(s)” notion, albeit rewarding results may take quite some time, (i.e. weeks if not months). Regardless, as Gold falters even though said trend is Long, one justifiably queries  ““What’s going on…” ” –[Marvin Gaye, ’71]
Cue Q2 Gross Domestic Product: the StateSide number as calculated by the Bureau of Economic Analysis came in at +2.8%. That annualized pace equaled the average of the 12 prior quarters (from Q2 ’21 through Q1′ 24), and belies the now three-month boffing of the Economic Barometer, which we’ve documented as so severe that a negative GDP might actually appear. But have no fear, as in this election year there’s no need to cry in one’s beer.
For from the “Credit Where Credit is Due Dept.” — stepping down as he is — U.S. President Joseph Robinette Biden, Jr. was described (with positive inference) this past week by Speaker Emerita Nancy Pelosi as “one of the most consequential Presidents in American history.” And the (if believable) +2.8% GDP annualized growth rate to an extent proves her point.
Thus with the economy in satisfactory shape, the Federal Reserve can justifiably maintain The Bank’s 5.25%-5.50% FedFunds rate range come the Open Market Committee’s vote this next Wednesday (31 July). So whereas Gold was seeking upside impetus from a downside rate, ‘twould now appear the yellow metal shall have to wait.
Admittedly with respect to the interest rate level of FedFunds, year-to-date we’ve been all over the place:
We began this year that — despite all the parroted bilge for multiple FedFunds rate cuts — inflation remaining well above target (+2%) was such that the Fed instead ought put the rate up;
But then the leading ramifications of the Econ Baro’s decline had become so extreme, we put forth that come 31 July, the FOMC would basically be “forced” to cut;
Yet now — given the Fed appears oblivious to the Econ Baro’s dropping like a stone — that “happy” +2.8% GDP pace gives the FOMC space to delay any cut toward assessing their next economic case (18 September), which is ‘natch what the FinMedia is mandating the Fed do in this race.
Moreover, let’s review inflation for June, our table updated as follows. And as you regular readers know, those readings with red backgrounds are running above the Fed’s +2% target:

The alarming number therein is “PPI-Core” in the June Annualized column: +4.8%. As such wholesale inflation gets passed on to retail inflation, July’s “CPI-Core” may become more, (just in case ’tis at home you score). And with respect to Gold, inflation lingering “above target” may restrain rate relief, thus keeping further material price rises in the yellow metal at bay … at least that’s what monetary theories say.
The bottom line is: with GDP proceeding at an acceptable pace, the parroted assumption of no imminent rate relief, and inflation not (yet?) really ’round the Fed’s desired +2% target, Gold is taking a bit of a hit … plus not to overlook her, Silver took a helluva hit. Since Gold’s 2488 All-Time High just this past 17 July, its price has fallen as much as -5.5% (to 2352) toward settling yesterday (Friday) at 2386. But Silver across the same stint has dropped -13.0% (from 30.80 on 17 July to 27.56 this past Thursday).
Encore: “Poor ol’ Sister Silver!” And as we turn to Gold’s weekly bars from a year ago-to-date, at the foot of the graphic is the Gold/Silver ratio now 85.0x, its highest reading since 03 May, (following which the white metal firmly rallied from the 26s up into the 32s: do not forget the Silver!)

To be sure, Gold has recorded a second parabolic Long trend blue dot. But: price therein has dropped for both weeks. And yes, that does hold some historical significance, (not that it must repeat). Either way, century-to-date (which for you WestPalmBeachers commenced 01 January 2001), Gold has initiated 51 weekly parabolic Long trends: but this is just the fourth one wherein at the start of the trend price has fallen for two successive weeks. In the prior three cases, Gold did not fare well over the near-term.
‘Course this conflicts with that penned a week ago: “…the fresh parabolic Long trend “ought” see yet another All-Time-High, shall we say, “sooner than later”. Across the past ten Long stints, the “median maximum” price increase for Gold is +6.5%, which (in that vacuum) from here would bring 2559…”
“But, ‘It’s different this time’, right mmb?“
Squire, your duly appreciated optimism may well ring true. And ’tis not just given geo-political issues from the U.S. right ’round the world having run amok, nor the non-existence of money to cover that which folks consider they’re worth, (i.e. “print print print” when it all goes wrong), but the most important fact that by Dollar debasement per our opening Scoreboard, Gold today at 2386 is priced -36% below its 3708 valuation. “Got Gold?”
As to the aforementioned eroding Econ Baro, here ’tis:

Such dichotomy to behold! ‘Tis parroted here, there and everywhere that economically all is well, even to the extent of some +2.8% growth in GDP. And yet to mathematically run the 50+ monthly incoming metrics which create the Baro, ’tis terrible! Just his past week alone, slower than May were June’s readings for both New and Existing Home Sales, slower was growth in both Personal Income and Spending, and shrinking were Durable Orders. Reprise: “We’re going the wrong way!” And whilst we’ve not uttered the “S” word in our most recent missives, given the aforeshown summary of inflation for June, dare we remind you of stagflation?
And what about the stock market? Prior to Friday’s relief rally from a mildly “textbook oversold” S&P 500, the Associated Press referred to the intra-week selling as a “wipeout”. Honestly folks, they (along with other elements of the FinMedia) don’t know what a “wipeout” is: rather, this is mere noise. Indeed last Wednesday, the S&P dropped -2.3%: the first “circuit breaker” halt via the S&P Futures doesn’t even kick in until -7%. Elaine Garzarelli’s induced “Black Monday” (19 October 1987) saw a single-day drop in the S&P of -21%. Yet in today’s Investing Age of Stoopid, a -2.3% pullback is considered a “wipeout”? Good grief. Folks’ lack of market history, knowledge and valuation is stunning.
Just remember (yes, ad nauseum) when it comes to the stock market:
The “live” price/earnings ratio of the S&P 500 now stands at 39.7x, a ridiculously high level given ’twas just 25.4x at its inception 11 years ago, made all-the-more overwhelmingly risky today considering back then U.S. T-Bills essentially had zero yield whereas today they return 5%;
The market capitalization of the S&P 500 settled yesterday at $47.7T supported by a U.S. liquid money supply (“M2” basis) of just $21.0T. Ask your investment banker if they’ve started printing their IOUs. (They probably won’t get it).
Or as we on occasion quip: “Marked-to-market, everyone’s a millionaire; marked-to-reality, nobody’s worth squat.”
Still always worth at least a peek is our two-panel graphic of Gold’s daily bars from three months ago-to-date on the left, and 10-day Market Profile on the right. The baby blue dots of regression trend consistency clearly have turned tail: upon their passing down through the 0% axis, such trend shall have rotated from positive to negative. As far as trading support and resistance, we’ve the former notably at the Profile’s 2374 apex, whilst the latter’s levels are as labeled above current price:

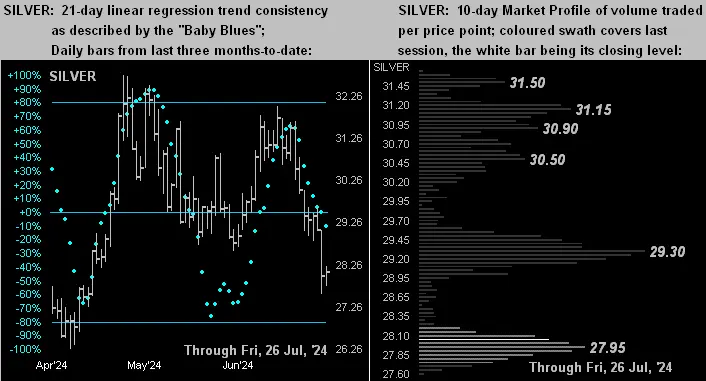
Ever so similar is the like graphic for Silver, albeit her regression trend by the “Baby Blues” (at left) already has rotated to negative; meanwhile (at right) her Profile’s support/resistance trading volume apices are as cited. And with earlier reference to the Gold/Silver ratio now at 85.0x, were the white metal priced today by that metric’s century-to-date average of 68.3x with the yellow metal now 2386, Sister Silver would instead be +24% higher at 34.92: that price has not traded since 05 March 2012:

And so into Fed Week we go, replete with 14 more metrics for the Econ Baro including Payrolls data for July. But don’t be shy. True, Gold may be punched about a bit through these ensuing weeks. However: even as Gold hovers ’round our 2375 forecast high, hardly would we rule out price exceeding 2500 before this year is out. So rather than pout, ensure you have Gold throughout!

Cheers!
