Since Friday of last week, gold has been breaking above the technical/psychological $2,500 level. As I mentioned to my colleagues, this appears to be another buying leg that is not explained by the usual market variables (currencies, yields, curves, spreads, CFTC1 & ETF, etc.). This week's calculations indicate this is continuing. My best guess remains central banks or sovereigns, but it is unlikely China. In January, I wrote that the good news was gold would do very well in 2024, but the bad news was that we might not know precisely why, beyond "central banks and sovereigns", and we would lack high-frequency data to track/confirm this development. YTD, gold is up 21.86% as of August 20, 2024.
Gold's Bearish Cup and Handle Pattern
At the start of the year, gold bullion had one of the most bullish high conviction charts I have seen in a long time, with clear bullish patterns in the broad and micro pattern structures. Figure 1 highlights the main macro pattern: the cup and handle chart (purple lines).2 This chart stretches back 30 years in its development. The 1990s was a long, protracted bear market driven mainly by a significant U.S. dollar (USD) bull market and relentless central bank selling of gold.
The 2000s' spectacular gold run was driven by a major USD bear market and the debt expansion wave to bail out the housing bust and financial crisis (2008-2010). For the past 12 years, gold has developed a cup and handle pattern (a close cousin to the head and shoulders reversal pattern3). The green line marks the breakout resistance level, and the upper purple line marks the $2,600 target level.
We are approaching the $2,600 with a lot of momentum. My best guess is that gold might hit the $2,600 level and consolidate for a bit before potentially advancing to the $3,000-3,300 range (shape and pace to be determined). The $3,000/3,300 range is based on where Fibonacci projection targets4 are clustering.
Figure 1. Gold Price Momentum (1990-2024)

Source: Bloomberg. Data as of 8/19/2024.
A Surge in Call Options on Gold Futures
This year, I have noted the call wall plot of gold futures and GLD (SPDR® Gold Shares ETF). Figure 2 highlights the surge in call options with +$2,490 strikes since mid-July. There has been approximately a doubling of notional ounces with a +$2,490 strike from ~4.8 million ounces in mid-July to ~10 million ounces today (thus far). Gold-related calls have also notably rolled up and out (higher strikes and longer-dated = bullish). Last Friday's (August 16) surge to the $2,500 level was likely due in part to option expiration effects.
Bottomline: Similar to past bullish runs, options activity has joined the fray and shown that they can significantly impact the gold price. If actual trading liquidity in gold becomes challenged, entry via options markets will have greater appeal.
Figure 2. Gold Futures Activity


Source: Bloomberg. Data as of 8/20/2024.
The recent price surge also does not appear to be driven by China. Figure 3 shows the Shanghai Gold Futures (longs, shorts, net) and the Shanghai Gold Premium, which were negative during gold's latest run. While China has been far away the largest net buyer of gold since mid-2022, according to World Gold Council data, China accounted for about 25% of actual central bank buying. Many central banks are buying, creating multiple bid layers.
Figure 3. Shanghai Gold Premium


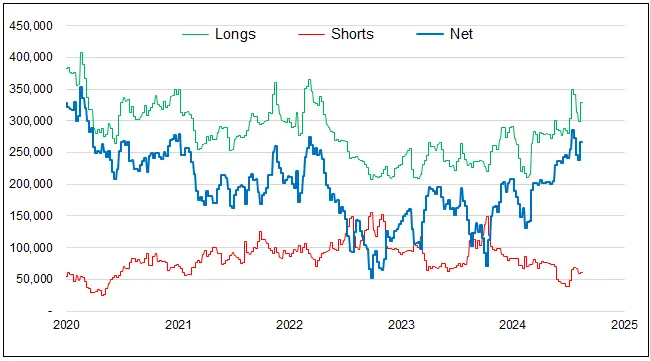
The last chart is a CFTC update. It appears that the degrossing and deleveraging have not only ended but have reversed to accumulation. Gold held in ETFs remains flattish to slightly higher. This potential source of weakness lasted two weeks. CFTC positioning relative to the past decade remains far from the upper levels.
Figure 4. CFTC Gold Futures (2020-2024)

Gold Is Likely to Move Higher
Bottomline: We believe gold will likely go higher, with signs that the supply of "free-floating available gold held inventory" is drying up quickly (i.e., significant size sellers are nearly gone).
Footnotes
1 | Commodity Futures Trading Commission (CFTC). |
2 | A cup and handle is a technical chart pattern that resembles a cup and handle where the cup is shaped like a "u" and the handle has a slight downward drift. A cup and handle is considered a bullish signal extending an uptrend and used to spot opportunities to go long. Source: Investopedia. |
3 | A head and shoulders pattern is used in technical analysis. It is a specific chart formation that predicts a bullish-to-bearish trend reversal. The pattern appears as a baseline with three peaks, where the outside two are close in height, and the middle is highest. Source: Investopedia. |
4 | Fibonacci projections use the Fibonacci sequence to determine potential price targets. The most commonly used Fibonacci projections are the 161.8%, 261.8%, and 423.6% levels, which are based on the golden ratio. These levels are used to identify potential price targets that the asset could reach after a retracement. Source: FasterCapital.com. |