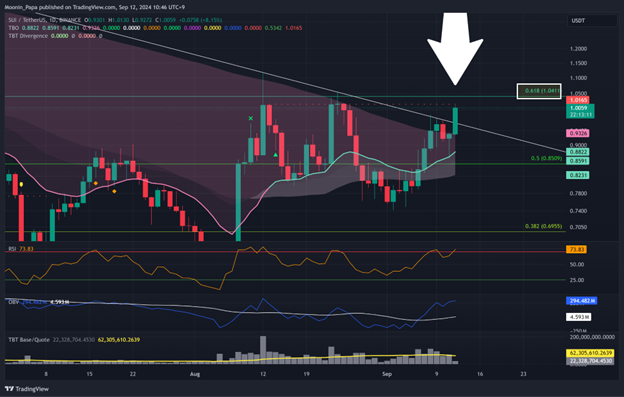
In a previous analysis, we explored the potential for $SUI to undergo a bullish reversal. After being heavily oversold since its peak in April 2024 at $2.18, $SUI has garnered increasing interest from traders, many of whom are anticipating a return to all-time highs in the coming months. While it was noted that the price was testing overhead resistance at that time, several key developments have occurred since, and the outlook for $SUI appears even more promising today.
In that earlier analysis, we highlighted how the price was testing overhead resistance after several failed attempts to break through. The $SUI chart also featured multiple TBO Close Short signals (indicating potential trend changes), along with the price finally closing above the daily TBO Cloud for the first time since April. These were early signals of a potential bullish reversal toward the $1.80 range, with a longer-term outlook predicting a return to all-time highs by early 2025.
New Developments: A Critical Resistance Test Approaches
Fast forward to today, and $SUI has indeed pushed past the initial overhead resistance (marked by the white diagonal line), which is a positive development. However, now the focus shifts to another key level: $SUI needs to close above the $1.00 psychological resistance level. The $1.00 mark is not only significant from a psychological standpoint but also aligns with TBO Resistance at 1.0165. This convergence of technical and psychological resistance makes it a crucial level for traders to monitor.
Beyond this level lies the 0.618 Fibonacci retracement, another well-known resistance point that has historically played a pivotal role in supporting or capping price movements. $SUI's price has already tested this level twice in recent weeks but was unsuccessful in breaking through. As the saying goes, "third time's the charm," and with the price now pumping up and out of the daily TBO Cloud, there is a strong likelihood that $SUI could break through this resistance soon.
Expectations Moving Forward: Consolidation Before Breakout?
Although the price action is looking bullish, it's important to remember that significant resistance levels can take time to overcome. We could still see more consolidation and price tests around the $1.00 range before a definitive breakout occurs. Traders should be prepared for some volatility and sideways movement as $SUI works its way through these resistance points.
If $SUI can successfully close above $1.00 and break through the 0.618 Fibonacci retracement, it could set the stage for a strong move toward the $1.80 range, as predicted in the previous analysis. However, achieving or exceeding the current all-time high of $2.18 may still take some time, with early 2025 being the more likely timeframe for such a move.
Summary of Key Takeaways:
- Overhead Resistance Broken: $SUI has successfully broken above the white diagonal resistance line but now faces psychological resistance at $1.00 and TBO Resistance at 1.0165.
- Key Fibonacci Level: The 0.618 Fibonacci retracement is the next critical resistance level to watch, which has rejected $SUI twice before.
- Bullish Momentum Building: The price has pumped up and out of the daily TBO Cloud, a bullish signal that suggests consolidation and tests of the $1.00 range may be short-lived before a potential breakout.
- Long-Term Outlook: While the immediate target is around $1.80, the all-time high of $2.18 may not be reached until early 2025, based on current market conditions.
As always, traders and investors should keep a close eye on these key levels and remain cautious in their approach. While the bullish signs are encouraging, it's important to remember that markets can be unpredictable, and resistance levels are often met with volatility.