

Bitcoin Holds Bullish Structure After Closing Above Resistance

BTC closed yesterday above TBO Resistance at $120,090 and remains in strong bullish mode above the daily TBO Cloud. Daily volume exceeded the yellow moving average, reinforcing positive momentum. However, the real standout was ETH, which surged 8% in a single day following lower-than-expected CPI data that triggered a broad crypto rally. The 4h TBO Breakouts for ETH, first spotted on August 8th, signaled the start of this move, and ETH has now climbed 12% from that signal. ETH/BTC closed up 7% yesterday and is just 3% shy of the 0.5 Fibonacci level, with the setup suggesting more gains soon.

ETH/BTC Breakout Underscores ALT Momentum Shift

The ETH/BTC pair has gained 13% since the 4h TBO Breakout signal, continuing a sharp rise as ETH leads the market. The move shows how ETH’s dominance often precedes broader altcoin rallies. Combined Stablecoin Dominance fell 2.5% yesterday and is still sitting on TBO Support at 5.75%. As ETH moves toward its previous ATH, further declines in stablecoin dominance are likely. BTC Dominance confirmed this rotation with a third TBO Breakdown on the daily, a strong signal historically associated with upcoming altcoin strength.
Historic Breakdown Clusters Signal ALT Seasons Ahead

Zooming out on the BTC Dominance daily chart reveals a rare and powerful signal: this is the first TBO Breakdown Cluster since July 2022. Similar clusters in July 2020 and April 2021 preceded major altcoin rallies. Stablecoin Dominance also dipped in those prior cases before bouncing during September corrections. This context suggests we're currently in a pattern resembling July 2020 — one that led into a historic run for altcoins.
ALT Dominance Charts Confirm Rotation Is Underway

OTHERS.D reflects similar dynamics. A short-term drop in July 2020 eventually led to a multi-month ALT rally beginning in January 2021. In April 2021, the move was shorter-lived but still mirrored this structure. ETH Dominance also followed the same script, pumping on the exact dates of prior BTC.D breakdown clusters. Despite narrative changes, ETH appears poised to repeat this leadership role.
Macro Trends Suggest a Temporary September Setback

While current signals are bullish, history warns of September turbulence. In both 2020 and 2021, these bullish setups led to pullbacks in September. The Crypto Historical Market Performance sheet backs this up — September is historically the worst month for crypto, even in bull markets. August tends to be green, but 9 out of the last 14 Septembers have closed red. This pattern suggests a market-wide dip could be imminent, especially for altcoins.
Altcoins Break Out Across the Board

XRP remains sluggish despite holding above its Cloud, while BNB inches toward its ATH. SOL finally joined the rally with a 10% daily move. TRX is working on a third TBO Breakout, and LINK is testing overhead resistance near $24.50. BCH, LTC, and UNI all had strong closes above key levels. CRO flashed a short-term warning with a TBT Bearish Divergence Cluster on the 4h.
Momentum Names Continue to Shine Across Ecosystems
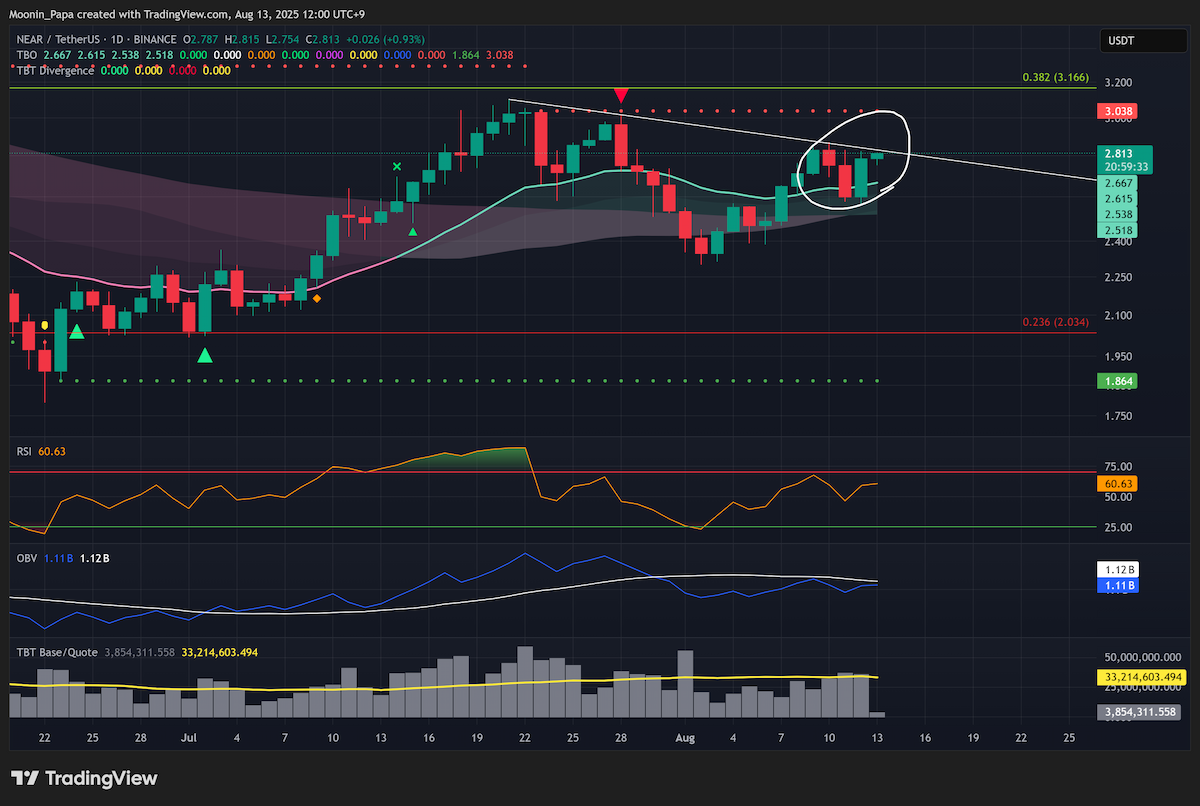
AAVE, NEAR, APT, and BONK all showed signs of strength, with breakout clusters or confirmations appearing on various timeframes. SPX6900’s momentum has slowed, but the macro trend remains bullish. JUP is climbing alongside SOL, and TIA is hinting at a bottoming structure with a new 4h Bullish Divergence signal.
While caution is always necessary, the current environment offers numerous opportunities across the board.
Learn my strategies and the tools I use every day by visiting The Complete Cryptocurrency Investor by Mastering Assets.