
Gold was extremely overbought in the spring & due for a rest. It has corrected bullishly but is far from its 200-day moving average.
Meanwhile, breadth indicators in gold stocks are flashing some warning signs.
Let's dig into both.
We start with the quarterly chart of Gold.
It's not the end of the quarter yet, but the message from Gold's quarterly RSI stands.
Gold is very overbought.
Considering quarterly RSI, Gold is as overbought as it was in 1972, 1973, and 2006. The other similar overbought points were later in secular bull markets.
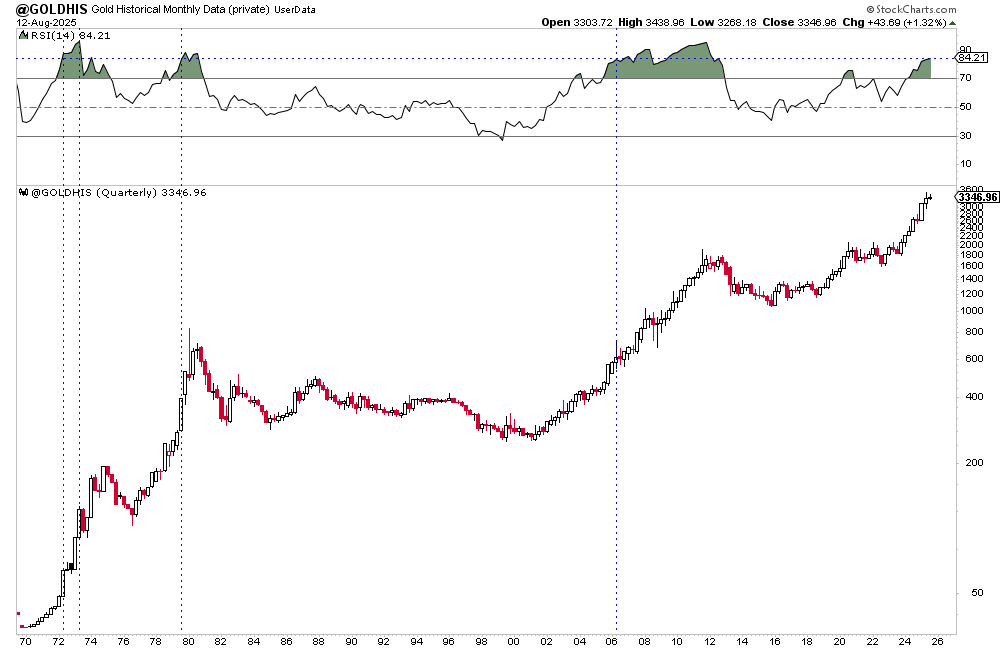
How do those points compare to the present?
In 1972, Gold corrected 12% for 4.5 months and came within 3% of the 200-day moving average.
In 2006, Gold corrected 23% for 5 months.
In 1973, Gold corrected 28% for 5.5 months.
At present, Gold is clearly closest to 1972. It has corrected 11% for nearly four months.
There are two conclusions.
First, after Gold's failed breakout from last Friday, the correction figures to last longer and could come very close to testing the 200-day moving average.
Second, if Gold begins another leg higher that exceeds $4000, then in 2026 there is a severe risk of +20% correction, ala 1973 and 2006.
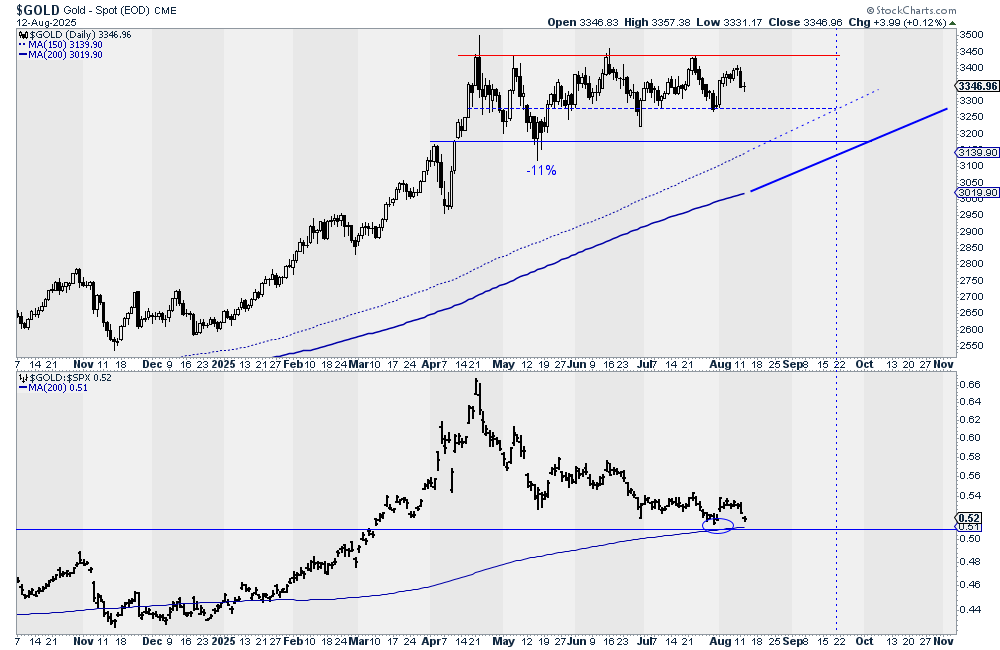
Turning to the present, we see Gold is $300 above its 200-day-moving average in the spot market and $280 above it in the futures market.
The spot market could test $3275 again, and if that breaks, there is downside potential to $3150-$3200.
In the spot market chart below, the 200-day moving average will surpass $3100 in September, around the time the correction turns 5 months old.
Gold against the stock market closed at 0.52. It has a confluence of strong support at 0.50-0.51, which will be retested again.
To confirm a trend change, we need to see the ratio close above 0.54.
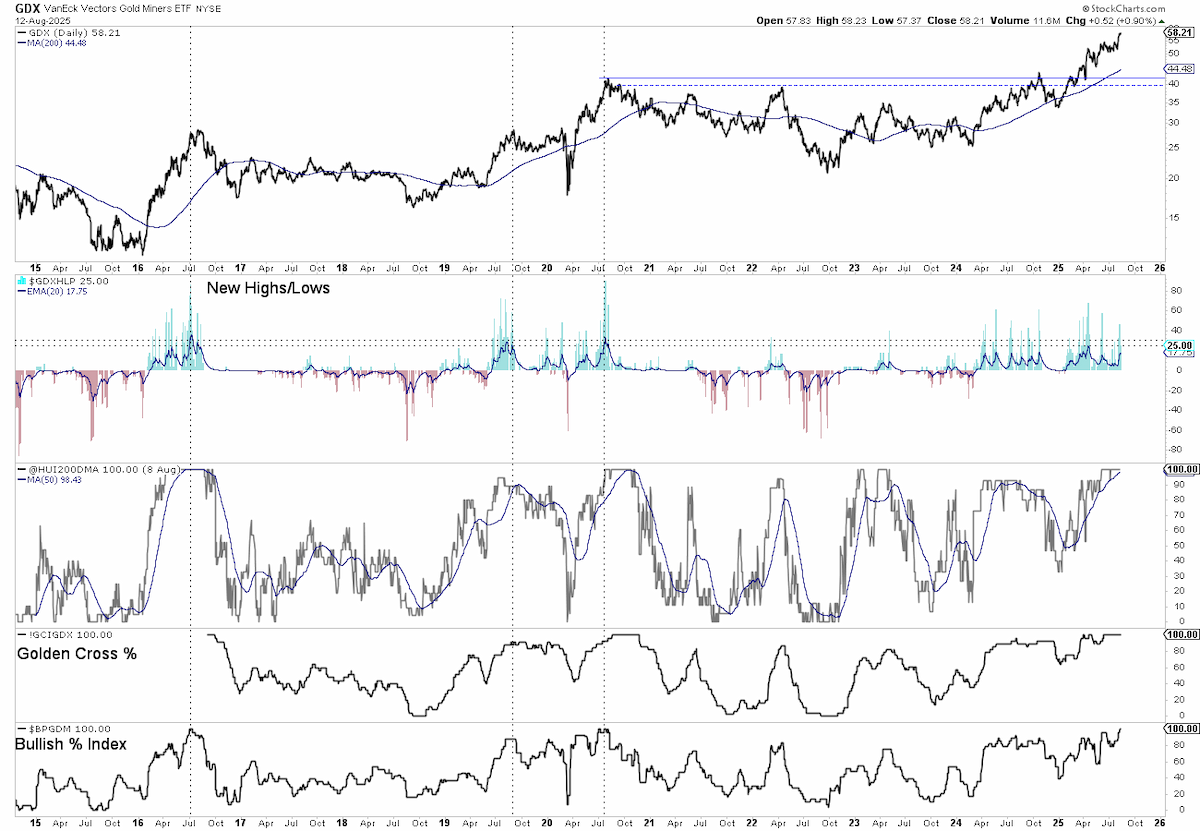
GDX closed at $58. The breakout from a 4-year-long base gives it a measured upside target of $63.
The bullish percentage index, golden cross percentage, and percentage of HUI stocks above the 200-day moving average are all at 100%.
Strong breadth is part of bull markets, and extremely strong breadth early in a trend is a very good sign. But extreme breadth that persists for a while can mark an interim or intermediate peak.
The 20-day exponential moving average of new highs is at 17.8%. Those aforementioned peaks since 2016 came at 30%-35%.
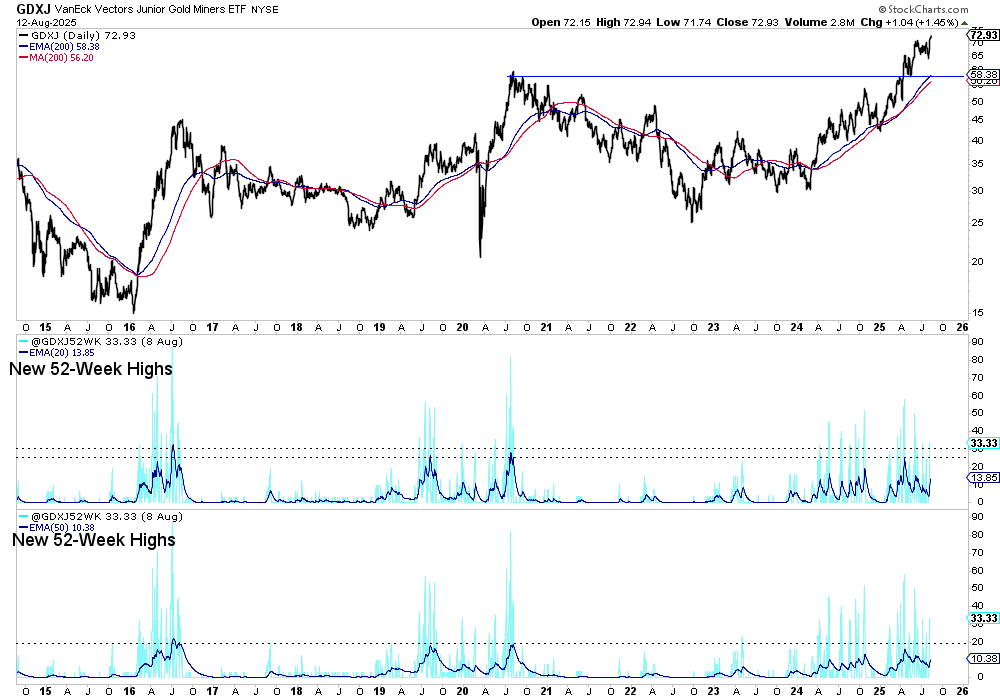
GDXJ closed just below $73. The breakout from a 4.5-year-long base gives it a measured upside target of $82.
Below, we plot the 20-day exponential moving average of new highs in GDXJ and the 50-day exponential moving average of those new highs. The EMAs of new highs are at 13.8% and 10.4% respectively.
The 23% correction in Q4 2024 reset this data for the strong move into April.
Until the start of last week, GDXJ had gone nowhere for 3.5 months, and that allowed the data to reset again.
The question is, if Gold corrects here into the end of summer, do miners make no progress? Or will they outperform like they have been in recent months?
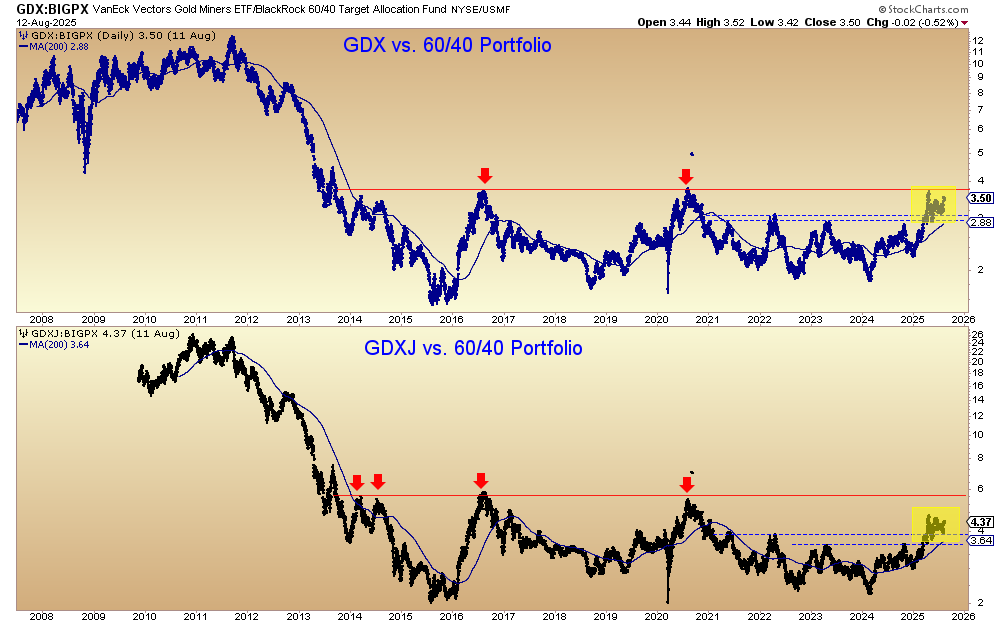
Finally, we look at how the miners are performing in real terms.
GDX and GDXJ are correcting bullishly against the 60/40 Portfolio (60/40 PF).
GDX against the 60/40 PF closed at 3.50. Holding above 3.00 puts the ratio in position to break out from a 12-year-long base.
GDXJ against the 60/40 PF is right behind. It's correcting bullishly, too.
If the top chart were to break that base, then GDXJ against the 60/40 PF should run higher and test its 12-year-long base.
Precious Metals are at an interesting spot.
Gold has corrected for nearly 4 months yet remains overbought considering long-term RSI readings and its distance above the 200-day moving average.
Meanwhile, the gold stocks have strongly outperformed during this period. Some breadth indicators are quite overbought from a short to medium-term standpoint.
GDX against the 60/40 Portfolio is acting quite bullish and could threaten to break out from a 12-year-long base. That could initiate a major leg higher in the miners and juniors.
Another month or two of correction in the sector, entailing Gold sniffing its 200-day moving average while the gold stocks correct and breadth cools off, would be a very welcome sign.
One way to mitigate correction risk is to buy the right companies at good values.
That's what we do at TheDailyGold Premium.
To learn the stocks we own and intend to buy with 5x to 10x potential, consider learning more about our premium service.