

Today's trading session witnessed a synchronized decline across precious metals and equity markets, with gold futures experiencing their most significant technical breakdown in weeks while technology stocks led a broader market retreat.
Gold futures maintained a relatively stable trading pattern through Asian and European sessions, showing little deviation from Monday's closing levels. However, the market dynamic shifted dramatically when New York trading commenced at 8:30 AM ET. The precious metal quickly breached a critical support floor at $3,375, initiating a sustained decline that would define the session's narrative.
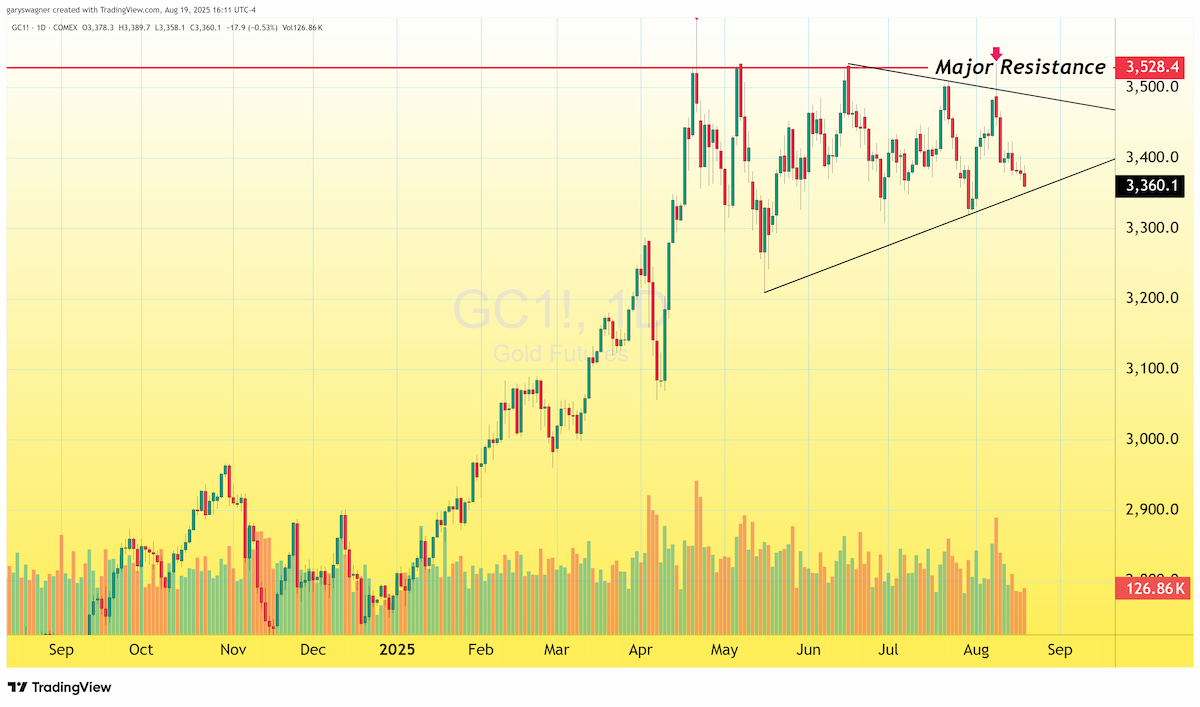
Over the subsequent four and a half hours, gold futures accelerated their descent, ultimately reaching the session's low at $3,358.90. This represented a substantial intraday loss of $24.60, or 0.73%, compressed into a remarkably brief timeframe. The decline marked gold's lowest trading level since August 1st, signaling a potential shift in the metal's recent consolidation pattern.
The equity markets mirrored this weakness, with technology stocks bearing the brunt of selling pressure. The Nasdaq Composite Index experienced particularly acute stress, declining 1.32% to close at 23,408 after surrendering over 300 points. This level represents the index's lowest close since August 7th, highlighting the severity of the technical deterioration. Notably, while the past five trading sessions have all concluded with losses, today's decline exceeded the cumulative drawdown of the previous four sessions combined, underscoring the acceleration in selling momentum.
From a technical analysis perspective, gold futures have suffered significant chart damage by falling below their 100-day simple moving average, a development that often signals a potential trend reversal. However, spot gold continues to maintain its position above its own 100-day SMA, a level it has successfully defended since January 6th. This divergence between futures and spot markets bears careful monitoring, as a breakdown below the $3,309 support level in spot gold would likely trigger additional technical selling and represent more severe chart damage.
Silver markets demonstrated their typical correlation with gold, declining $0.69, or 1.83%, to settle near $37.33. This level places silver futures precariously close to historical support at $37.37. More concerning from a technical standpoint, silver broke below its 50-day simple moving average for the first time since May 28th. During the 57-day period above this technical level, silver had accumulated gains of $3.90, or 11.67%, making today's breach particularly significant for momentum traders.
Should silver continue its descent, the next meaningful support level resides just above $36, with the metal's 100-day simple moving average providing additional backstop support around $35.50. These levels will likely serve as critical inflection points for determining whether the current weakness represents a temporary correction or the beginning of a more substantial retracement.
The coordinated decline across both precious metals and technology stocks suggests broader risk-off sentiment may be emerging in markets, with investors potentially reassessing recent positioning ahead of key economic data releases and Federal Reserve policy considerations. The technical breakdown in gold, particularly given its traditional safe-haven status, may signal underlying concerns about economic growth prospects or inflation expectations that warrant continued monitoring. Traders fears of what the Fed may signal at the annual Jackson Hole Symposium was the obvious driver today, the meeting set to kick off tomorrow will be closely followed by traders and markets and the tensions are higher than ever over the Fed’s future guidance.
For those that would like more information about our services click here
Wishing you as always, good trading,