Aug 26, 2025
- Gold is close to staging a massive breakout above the key $3440 price zone… and it's possible that a shocking PCE inflation report on Friday could be the catalyst for the launch.
- Note the fabulous inverse H&S pattern on the Stochastics oscillator (14,5,5 series). The triangle pattern is one of "technical perfection" and basis Edwards/Magee, it has a rough 67% chance of being resolved to the upside.

- In a nutshell, this supreme money gold chart is so aesthetic that it looks like the work of Michelangelo.
- What about the daily chart? If Michelangelo is working on the weekly chart, does Da Vinci have his hand on the daily? It certainly is another fabulous chart, one that is perhaps best described as… technical art:

- A bull cross on the 14,7,7 series Stochastics oscillator is almost in play in the momentum zone (near 50). Also, the consolidation has morphed into an ascending triangle. Like the weekly chart symmetrical triangle, this pattern also has a rough 67% chance of breaking to the upside.
- Finally, for a view of the short-term action via the hourly chart. There's significant inverse H&S action on this chart, which suggests a surge to that key $3440 zone is the next big short-term event for gold.

- It's clear that "all technical systems are go" for a gold price rocket launch that targets $3800-$4000 (basis both the daily and weekly charts).
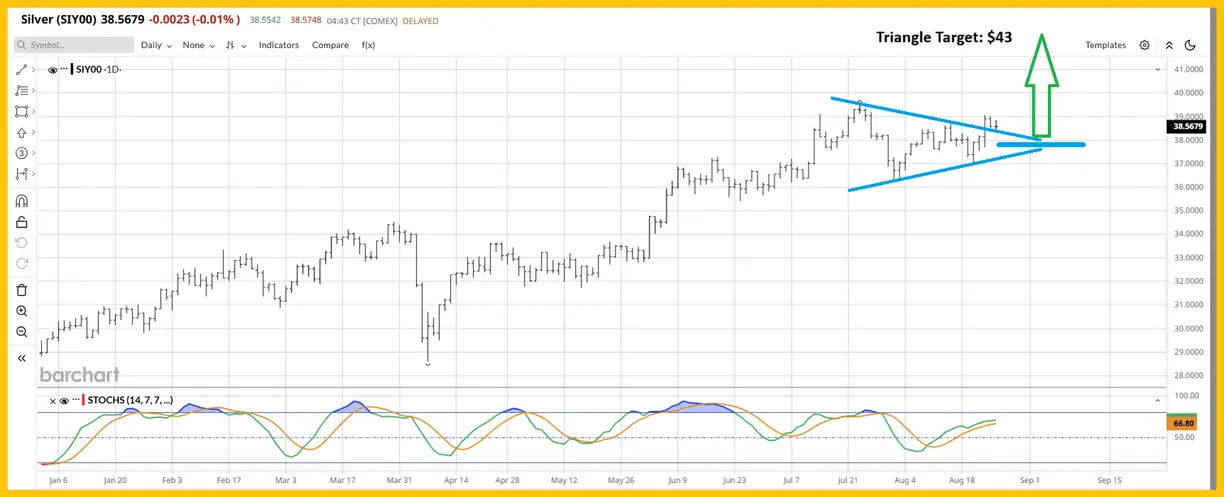
- What about silver? It's also looking very good. A key triangle pattern targets the $43 zone, and Friday's wild action featured a very nice upside breakout.

- From here, the rally could resume after a classic two-day pullback, and I'll note that Tuesdays are often (but not always) soft days for both gold and silver. A dip to the apex zone of the triangle is also common after these types of breakouts. Most importantly, the bulls are clearly in control.
- So, the gold and silver charts look fantastic, but what about the fundamentals? Well, central bank buying continues at a strong pace (except in America, not surprisingly, where gold buying is non-existent despite horrifying government debt). The US jobs report revisions are horrific and some money managers are starting to wonder if the coming reports will be produced by government puppets.
- The S&P500 Shiller/CAPE ratio looks like Icarus as it approaches 39.

- For perspective, the Chinese stock market CAPE ratio is about 15. US tariff taxes are now the highest in a century, but they barely put a dent in the monthly interest charges on the government's hideous debt, let alone in the debt itself.
- The size of that debt is why the US government is pushing so hard for lower rates rather than making DOGE cuts that are anywhere near as big as Elon Musk wanted them to be. Elon blew his top when he realized the cuts would never happen, and now the US stock market appears close to blowing its top too.
- Ominously, lower rates could cause a loss of confidence event in the government bond market. Savvy investors now want higher rates, not lower ones, to buy what is becoming an ever-more risky investment.
- Chinese insurers are finally being allowed to buy safe-haven gold in addition to risky government bonds, and on that note. The paint is barely dry on the Chinese insurer news, and now Indian pension funds may get the green light to buy gold too!

- After almost doubling in price from my October 2023 launchpad zone of $1810, gold is consolidating sideways instead of falling and that has the attention of more and more mainstream money managers.
- They are pouring into the miners, and many of these great stocks are surging on big down days for gold. A huge inverse H&S pattern is in play and the neckline sits at 1000. There's also an even bigger loose bull wedge formation. It targets a move to at least the all-time highs. As the rally intensifies, investors can expect to see "ten baggers and more" become the norm for many if not most junior mining stocks.

- The CDNX could easily rise to 10,000 or higher before the current cycle is complete. Clearly, junior mine stock investing isn't for everyone, especially with size, but as the gargantuan gold bull era rollout continues, these miners look set to outperform everything!
- Sentiment? A year ago, I urged savvy metals market investors to be open to the BPGDM sentiment index going into a trading range between 100 and 50…

- And doing it while gold stocks stunned the naysayers and top callers… and rocketed higher, higher, and higher! That's exactly what has transpired and is highly likely to keep transpiring in the coming years.
- The BPGDM is a technical index. It isn't actual investor sentiment. Actual amateur investor sentiment is still tepid, which is an ideal situation for significantly higher prices, mostly fuelled by institutional buying.
- Like their junior brethren, many senior miners are surging on both up and down days for gold. Simply put, they have been transformed into cash cows by the $3000+ gold price. A drop of a few hundred dollars an ounce doesn't change that fact.
- Double-click to enlarge what I've dubbed one of the three or four greatest charts in the entire history of markets. It's the long-term GDX versus gold chart. In 2014 I began highlighting the potential for the formation of this massive inverse H&S pattern… as the head began to form. Now, GDX is beginning to rise up from the head of the pattern. The rally to the possible neckline zone could see GDX trade above $100, and when Wave E is finally completed it could reach $200, $300, or even $500.

- The daily chart showcases the short-term action; every time GDX "should" fall, it pushes higher again. It's not simply a bull market. It's a bull era and the miners are set to be the multi-decade stars of the show!

Thanks!