Important gold ratios to markets that are more cyclical
When gold rises again vs. these markets the counter-cyclical economic view will generally be back on. Gold has far more utility (insurance, risk-off liquidity, relative value retention) during economically troubled times than cyclical assets like stocks and commodities.
Gold/SPX (U.S. stock market)
A sweet consolidation as the market angst of the spring has gone bye-bye. This is a lovely consolidation that was much needed as gold got over-pumped to the upside (and stocks to the downside) in April.

Gold/Global (World, ex-U.S.)
Another constructive downward consolidation in the monetary metal vs. global stock markets. Sure, it’s below the moving averages, which are about to Death Cross. You’d do well to tune such noise out. It’ll probably spring a rally in the ratio and in my opinion, end the correction.

Gold/CRB Commodity Index
A nice, flat consolidation riding the uptrending 50 day moving average. Counter-cyclical gold laying in wait to out-perform cyclical commodities into the next counter-cycle.

Gold/WTI Crude Oil
Another uptrending counter-cyclical marker, which is another way of saying another indicator trending toward a rude interruption, at least, of this phase of the economic cycle. The gold mining industry would benefit, fundamentally (product up in relation to cost input).

Gold/Copper
The market got a lot of noise injected by Trump expectations vs. what the Trump jawbone actually said (about copper related tariffs). But the moving averages show uptrends in Au/Cu the whole while. Star counter-cyclical metal bullish vs. star cyclical metal.

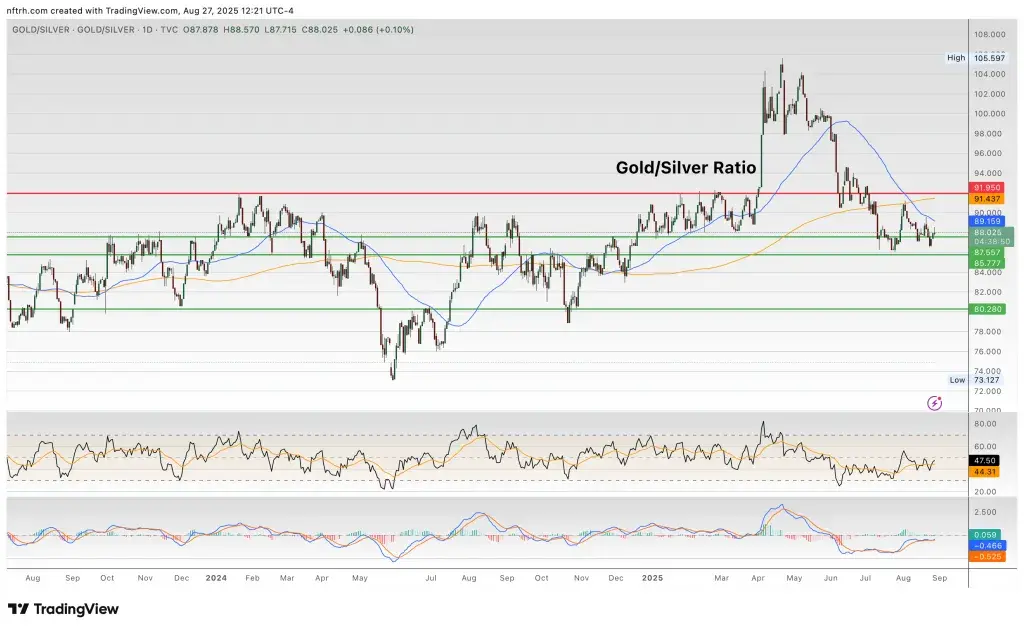
Gold/Silver Ratio
Moving on to a couple more complicated items, the post-April pullback in the GSR has given life to many “SGR trades” as I call them. Those with an implied tailwind with a rising Silver/Gold ratio. The GSR is still trapped below the moving averages and so, those trades drag on. But at such time as GSR may start to bull and drag the US dollar along with it, best to consider backing away from the punch bowl and stay away from the pool, because it’ll have a strange brown object floating in there.

Gold/Inflation Expectations
This ratio is sliding along bullishly. The indication is that inflation has not been a major problem since 2023. The indication is that the opposite of inflation could even come to be feared before the next inflationary phase.

For “best of breed” top-down macro analysis and market strategy covering Precious Metals, Commodities, Stocks and much more, subscribe to NFTRH Premium, which includes a comprehensive weekly market report, detailed NFTRH+ updates and chart/trade setup ideas, and Daily Market Notes. Receive actionable (free) public content at NFTRH.com and subscribe to our free Substack. Follow via X @NFTRHgt and BlueSky @nftrh.bsky.social, and subscribe to our YouTube Video Channel. Finally, check out Hammer’s trade (long and/or short) setups.