

BTC Signals Strength While Divergences Flash Warnings
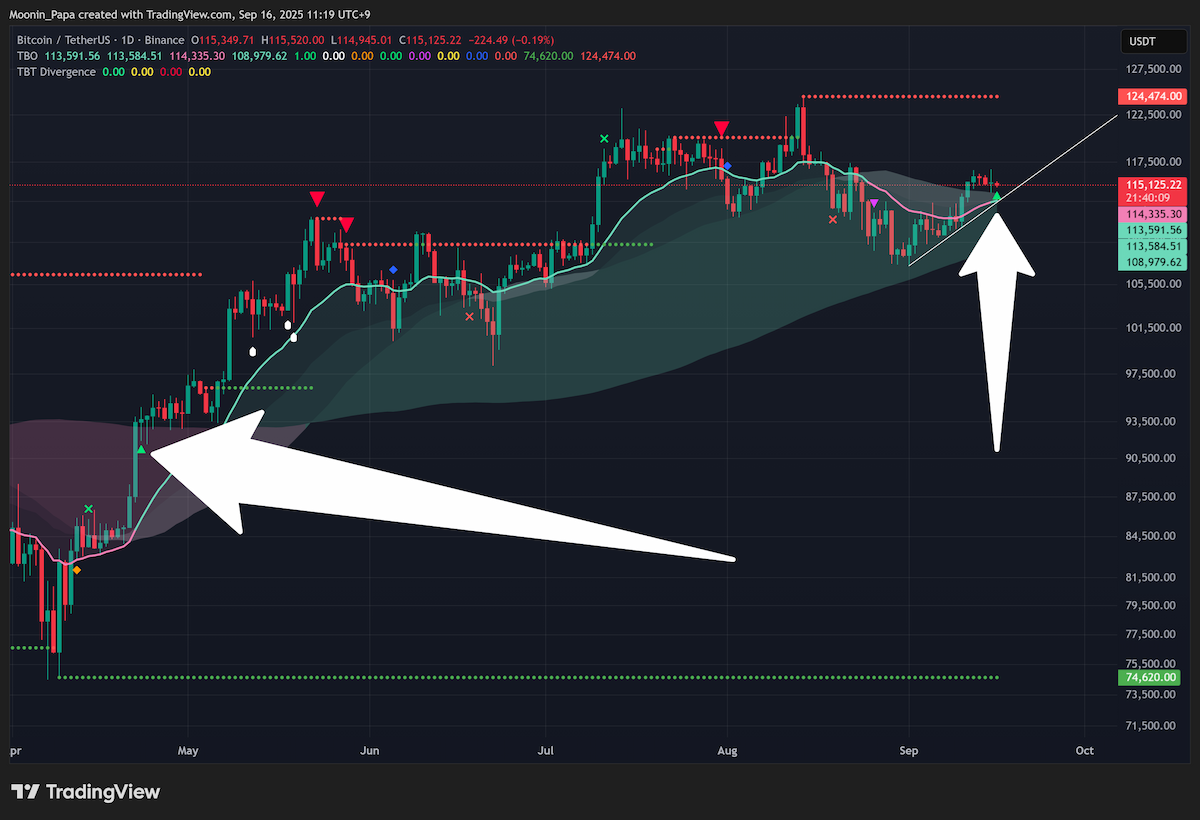
Bitcoin is showing potential for a TBO Open Long on the daily chart—a rare and bullish signal that last appeared in April before a 30%+ rally. However, the signal remains unconfirmed with 22 hours left in the candle. At the same time, two TBT Bearish Divergences have formed on the 4h, while BTC hovers near support at $113k. If the market wavers on the upcoming Fed rate cut decision, a bounce from this level is likely. Despite short-term risk, BTC is expected to push higher once the uncertainty clears.

Historical Patterns Suggest a Q4 Rally
September tends to be Bitcoin’s worst-performing month, but Q4 is historically its strongest. BTC could close green on a confirmed rate cut and push toward $120k, then potentially reach $150k by mid-November. However, a sharp pullback could shake the market before then. In 2021, BTC saw three major drops of around 27% each. While such depth isn’t expected this cycle, a sudden -15% drop is still a realistic risk—especially if leverage builds up.
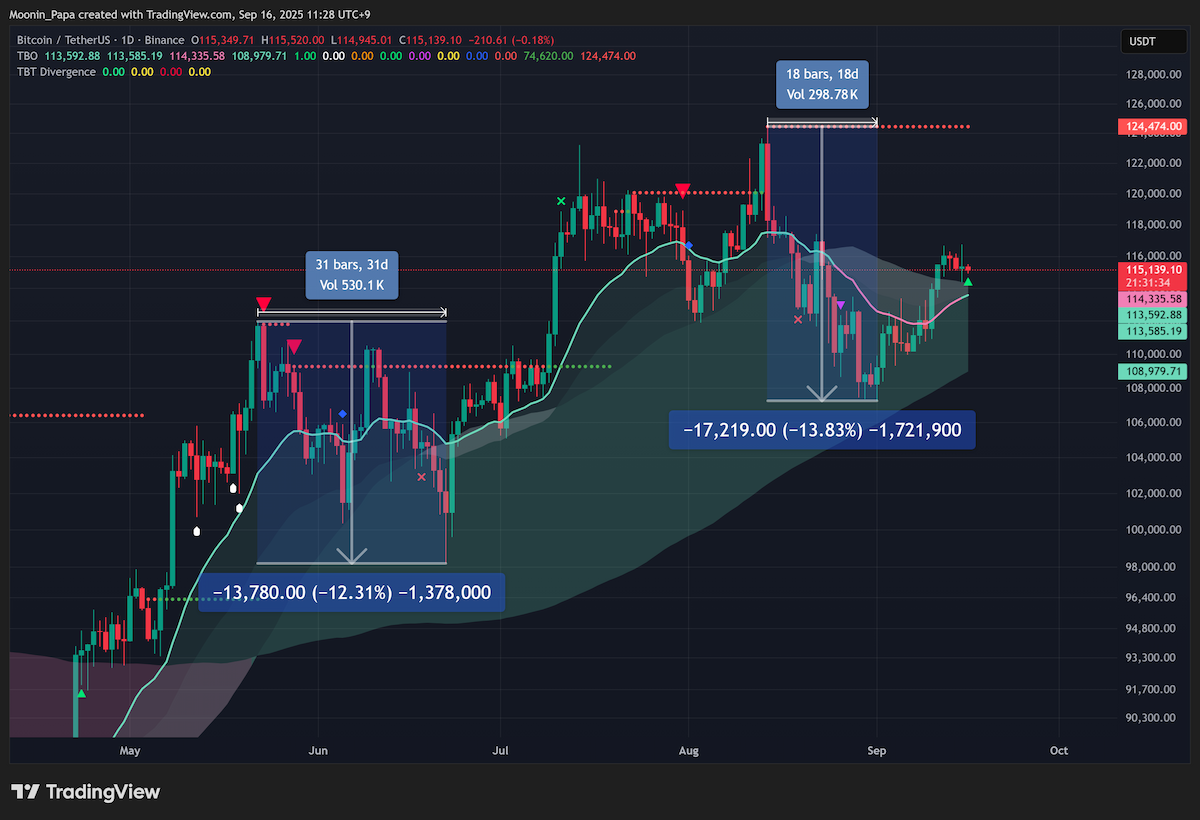
Not All Pullbacks Are Created Equal
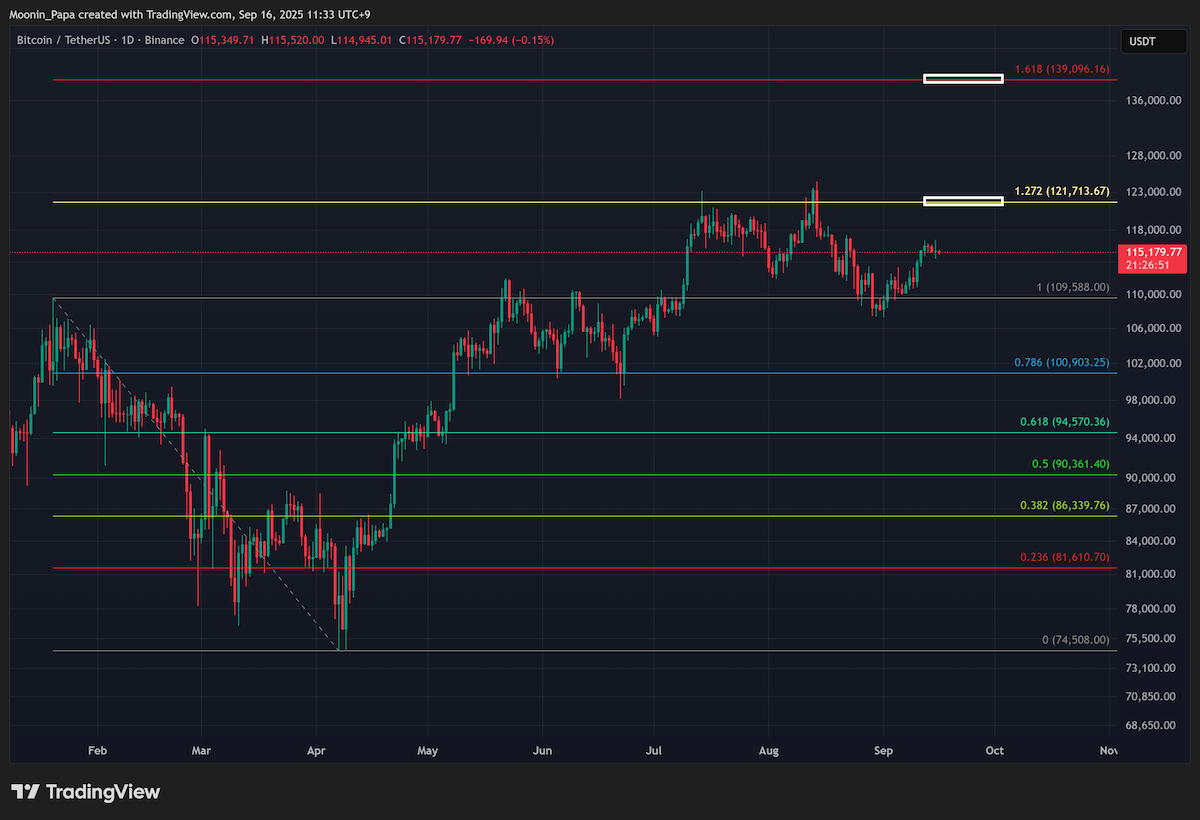
Recent drawdowns of -12% and -13% took weeks to develop, making them slow corrections rather than true pullbacks. A sharp, fear-inducing plunge is still likely to occur. Interestingly, chart patterns suggest the bottom may be in, and if history repeats, BTC could now begin a strong push toward new ATHs. Key resistance levels lie at $124k, $129k, and $136k, with $139k capping the Fibonacci range. Expect volatility, but the roadmap to new highs remains intact.
ETH Lags While Capital Shifts to Mid- and Low-Caps
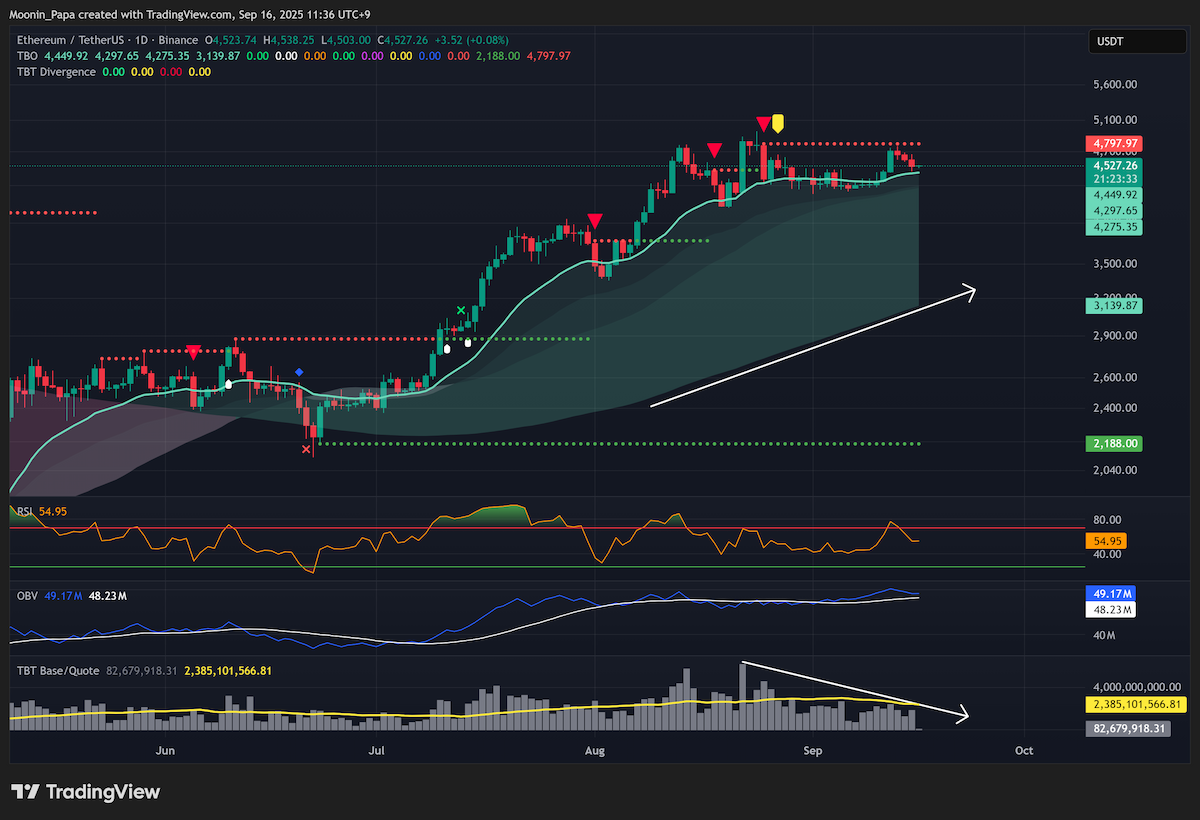
ETH remains macro bullish, but price continues to struggle below $5,000 with declining daily volume. While May and July saw strong inflows, interest has faded. Weekly indicators remain bullish, but traders are voting with their capital—and that vote is shifting toward mid- and low-cap assets. ETH is not weak, but it's no longer the most attractive risk/reward play in the market.
Dominance Charts Reveal Hidden Risks and Rotations
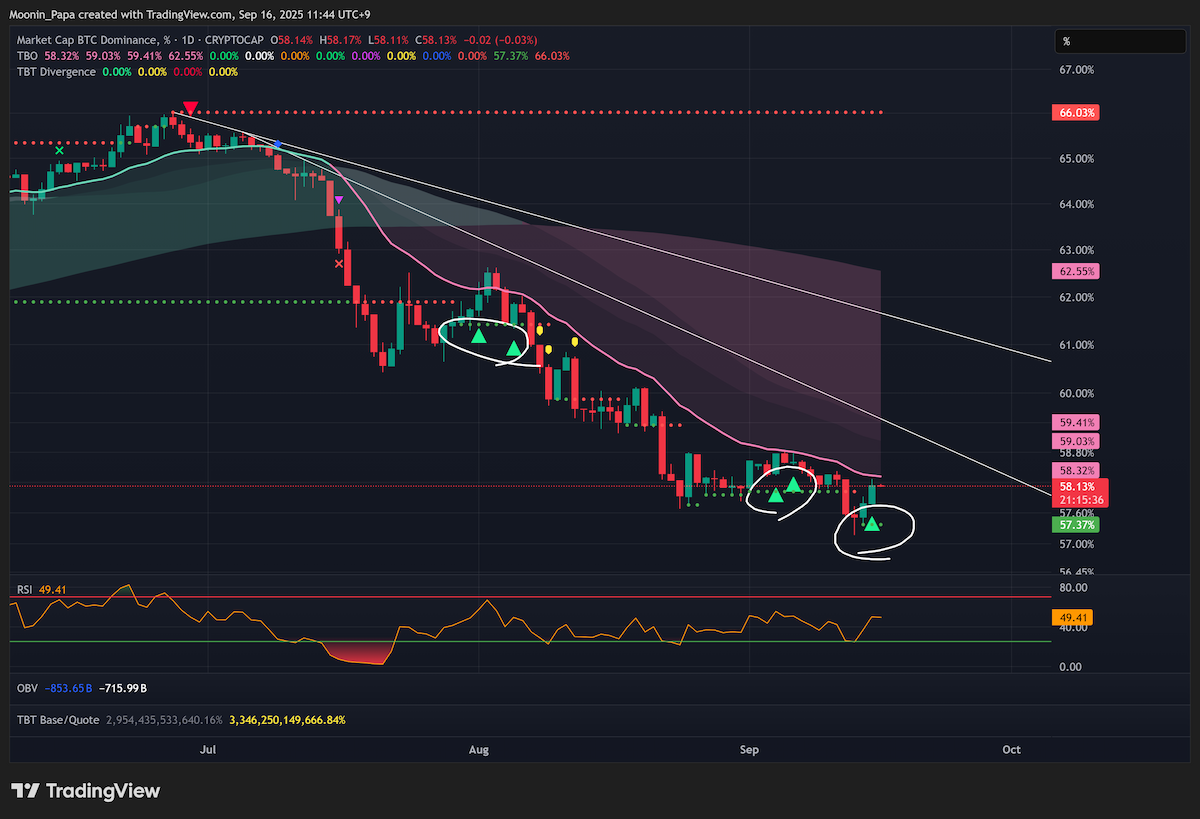
Stablecoin dominance is slowly rising, with short-term RSI pointing to a potential bullish reversal. A second TBO Close Short on the 4h shows caution is warranted. BTC dominance also printed another TBT Bullish Divergence, which could lead to altcoin weakness if BTC takes the lead. However, longer-term signals like the TBO Cross Down on the weekly BTC.D chart suggest BTC dominance could still trend lower, favoring alts. ETH.D, SOL.D, and others reflect this potential shift, though warning signs of local tops are appearing.
Alts on Alert: Some Pulling Back, Others Ready to Bounce
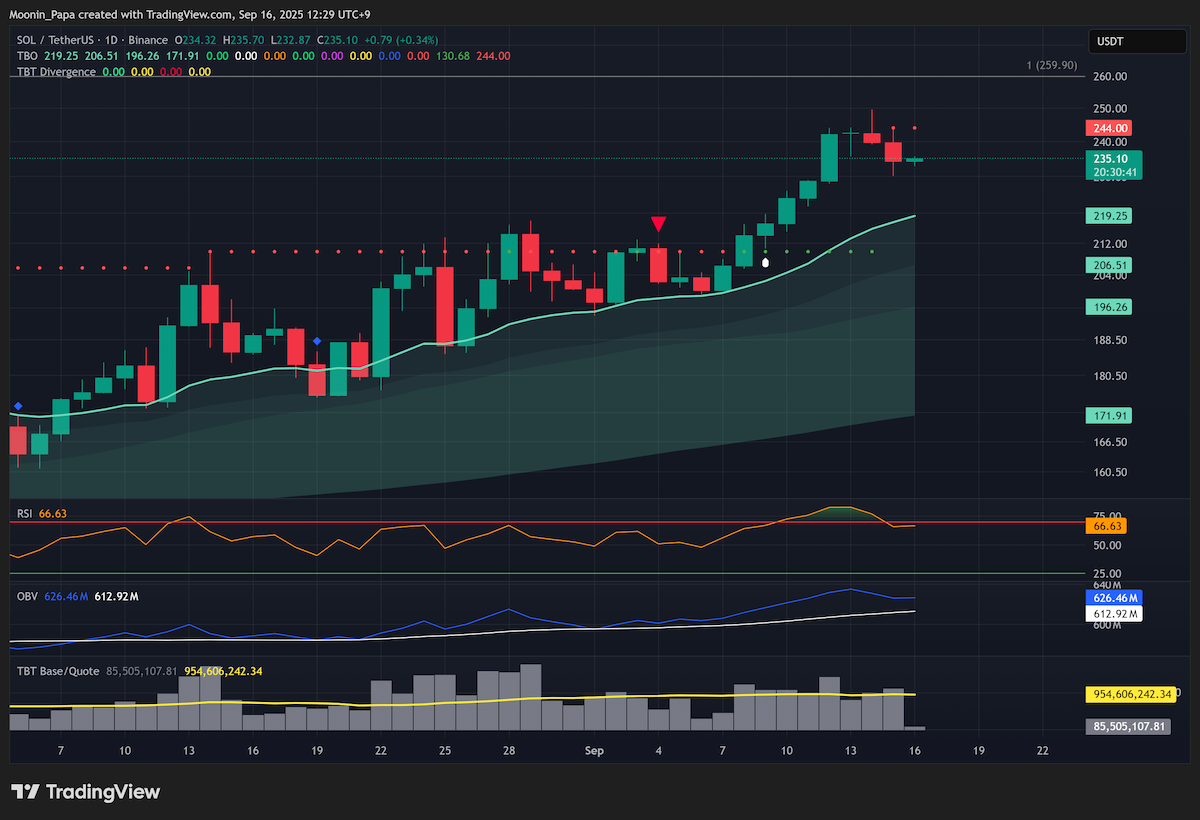
OTHERS.D and TOTALES.D show pullbacks similar to mid-August, with bearish divergence clusters appearing on TOTALE50 and TOTALE100. However, TOTALE50 just retested a key level for a possible bump-and-run setup, which could lead to an altcoin bounce. TOTAL3ESBTC remains strong, but recent bearish divergences create doubt. For Alts, attention now turns to strong charts like XRP, SOL, AVAX, MNT, IP, KCS, IMX, and even the overextended PUMP. Focus on simple, high-conviction plays and stay nimble.
Learn my strategies and the tools I use every day by visiting The Complete Cryptocurrency Investor by Mastering Assets.