

Market Liquidation Overview
The past 24 hours saw the largest single liquidation event in crypto history, with approximately $1.6 billion in long positions and $1.8 billion total liquidated. Despite this record drawdown, Bitcoin fell by only 3.1 % overall and declined about 2 % within a two-hour window, suggesting that the selling pressure may not have originated with BTC itself. Ethereum, by contrast, dropped 8.5 % over seven hours, indicating that ETH rather than BTC likely triggered the broad market unwind.
Bitcoin Technical Analysis

On the daily chart, BTC closed inside the TBO Cloud, signaling bearish consolidation. However, volume exceeded the yellow moving average, reflecting underlying demand, and the daily RSI held above 25, avoiding an RSI reset. Intraday timeframes show TBT Bullish Divergences on hourly and four-hour charts, with the 4h RSI reaching an extreme low of 8.18. Historically, such oversold readings preceded significant reversals, notably the April 7 bottom near \$74,000. A higher low on the 4h RSI over the next 48 hours would confirm a bullish turn and limit further downside.
Ethereum Performance and Signals

ETH’s daily metrics look more stressed, with RSI dipping to 25.71 and price trading deep within the TBO Cloud. On-balance volume crossed below its moving average, reinforcing bearish momentum. A key support level holds near \$4,100 on the weekly timeframe, but faster timeframes remain beat up following ETH’s mid-August all-time high near \$4,950. On the 4h chart, price has not yet reached the current TBO support band, offering a potential area for a relief bounce if buyers reemerge.
Dominance Metrics and Altcoin Outlook
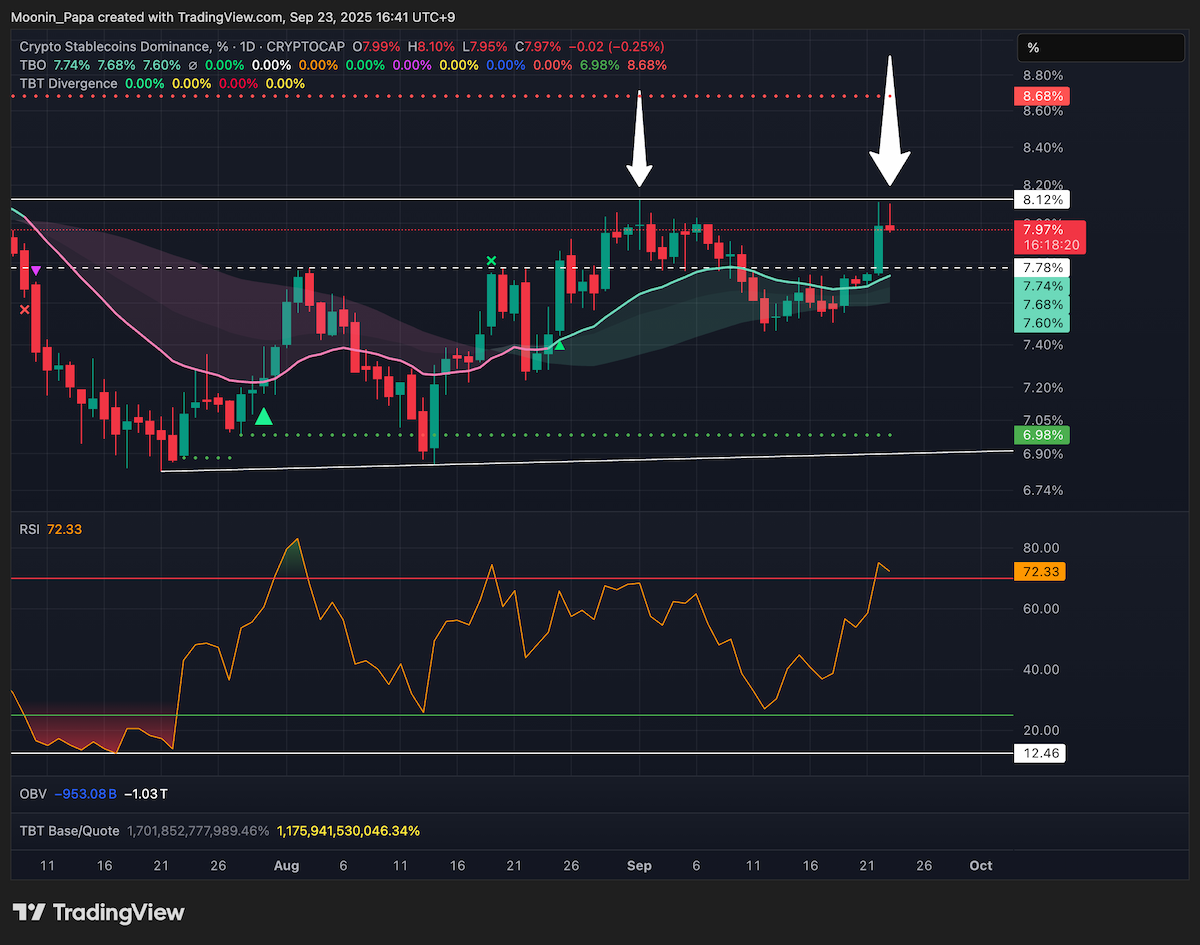
Stablecoin dominance spiked to 6.52 %, temporarily breaching the daily TBO Cloud, though the RSI peak at 73.9 remains below previous highs above 80, suggesting limited overextension. Bitcoin Dominance closed inside the daily TBO Cloud for the first time since August 2. On the weekly chart, BTC.D is approaching the TBO Fast line at 60.51 %, which would close two open TBO Close Long signals from July and August, then likely reverse toward 40 % over the bear market. SOL.D, ETH.D and Top 10 Dominance each printed TBT Bearish Divergences, while OTHERS.D generated a TBO Close Long on its recent drop. Total crypto market dominance (TOTALES.D) holds support near 92.78 % and shows a second weekly TBT Bearish Divergence in progress, echoing patterns seen before prior cycle peaks.
Macro Influences and Political Catalyst
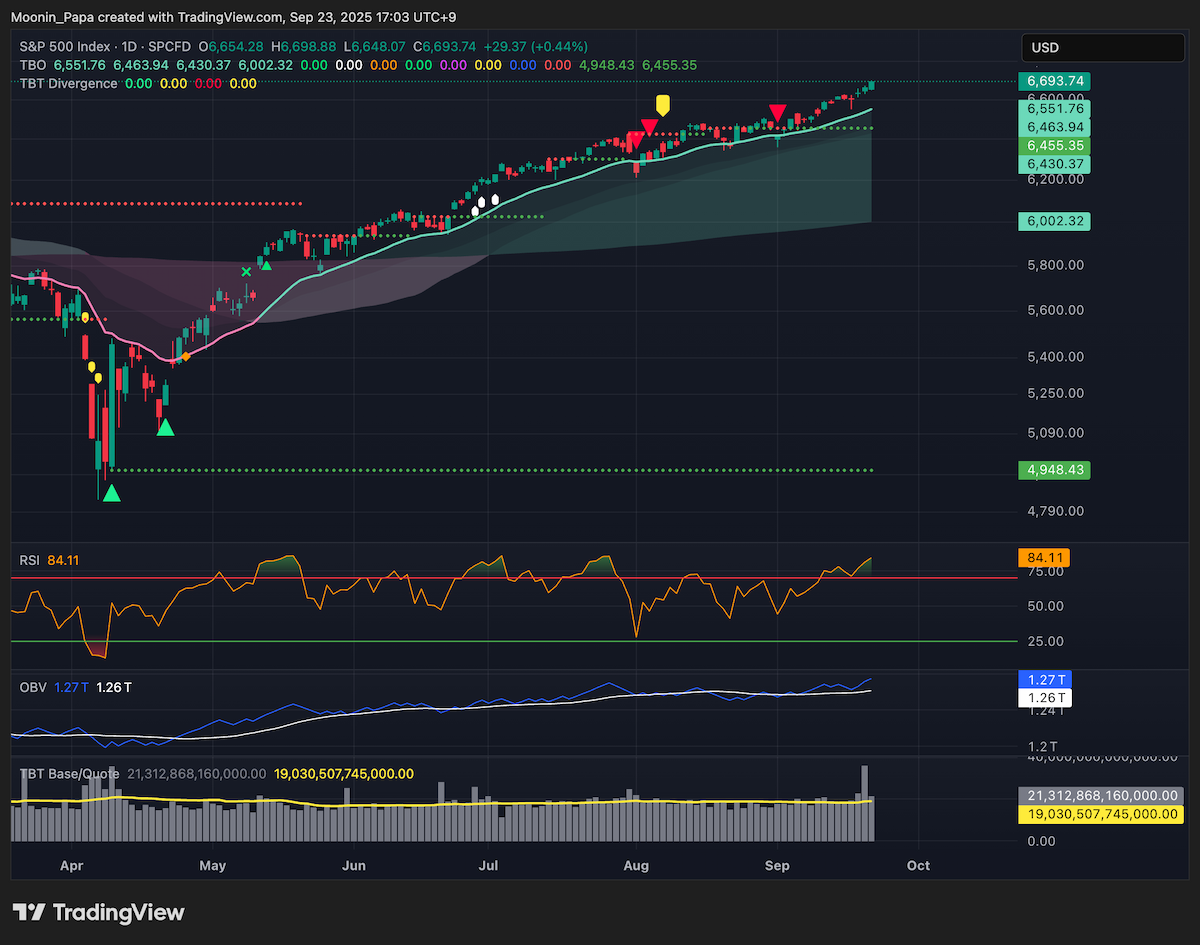
Traditional markets remain robust, with the S&P 500 hitting new highs and gold surging to a record \$3,755. In contrast, crypto markets experienced severe selling, potentially orchestrated ahead of anticipated political developments. A viral tweet from Dennis Porter referenced “massive political news coming for Bitcoin” this Tuesday, while a 12-foot golden statue of Donald Trump holding BTC appeared in Washington on September 18. Reports of a U.S. Bitcoin Strategic Reserve and a “digital asset stockpile” under a new crypto cabinet add to speculation that an official announcement could drive BTC substantially higher upon release.
Trading Strategy and Portfolio Guidance
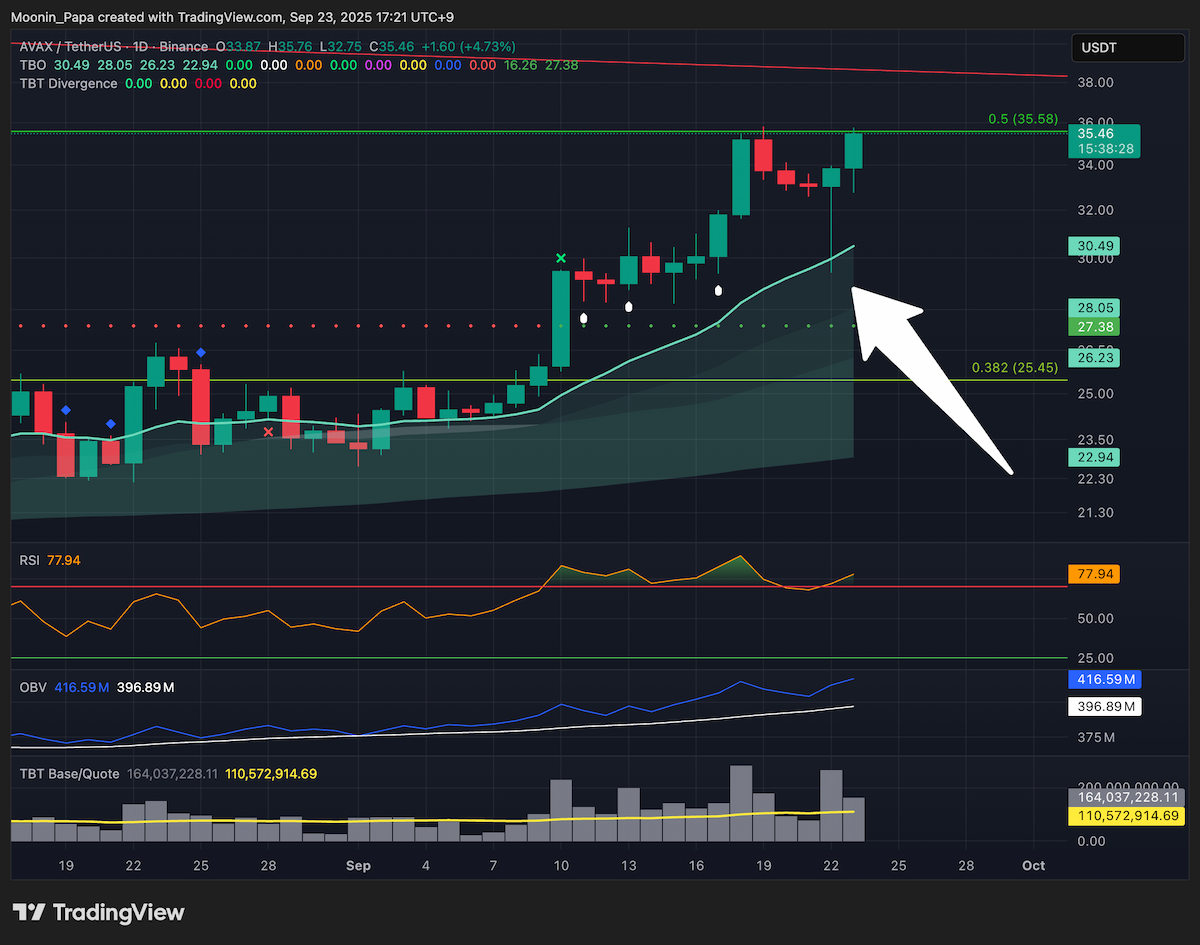
Given the uncertainty, the focus remains on protecting capital and targeting assets with resilient daily charts. Recommended alts include BNB, AVAX, MNT, NEAR, IPI and IMX, which have demonstrated strength and are positioned for recovery. When dollar-cost averaging into these positions, scale out 50 % at breakeven to reduce exposure. While the Tuesday announcement may catalyze a BTC rally, history cautions against “buy the news, sell the rumors.” Maintain defensive risk management until clarity arrives.
Learn my strategies and the tools I use every day by visiting The Complete Cryptocurrency Investor by Mastering Assets.