
Bitcoin Technical Analysis

Bitcoin is trading around $124,000 after closing slightly above the TBO resistance at 124,474. On the daily chart, upper wicks indicate short-term selling pressure, though the TBO remains strongly bullish. Key indicators show a daily RSI peak of 84.79—nearing the 86.70 threshold required for further acceleration—alongside rising OBV and consistent volume outperformance above its moving average.
Despite over-extension from the TBO Fast line, the balance of momentum suggests limited downside. A modest pullback to $121,000 could test the 1.272 Fibonacci extension before a potential advance toward the 1.618 level near $139,000. Traders should monitor price action for signs of consolidation similar to mid-July’s brief exhaustion.

Ethereum and Major Altcoins Behavior
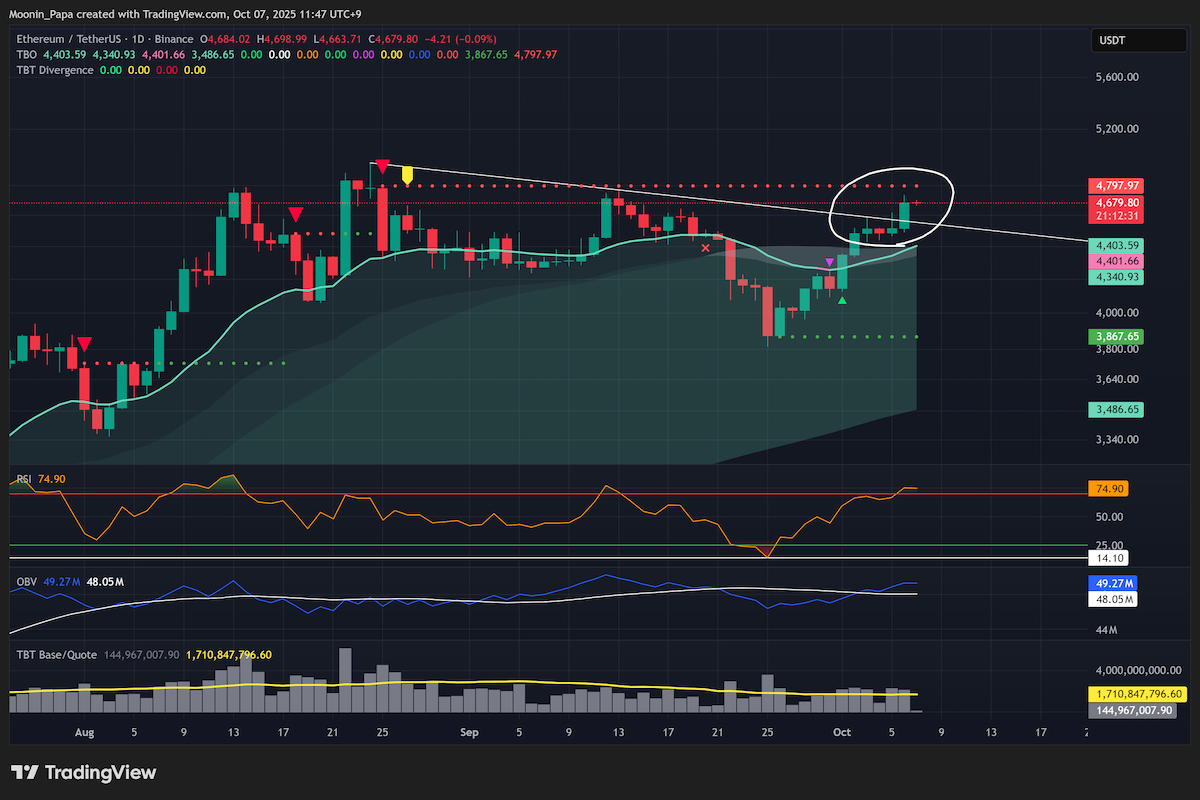
Ethereum has surpassed its overhead resistance, with daily RSI above 70, OBV holding above its moving average, and volume edging past its yellow MA since last Wednesday. However, the chart remains less robust than Bitcoin’s, and a recent 4-hour TBO breakout cluster may be more indicative of a topping formation than continued upside.
Other major altcoins are largely mirroring Bitcoin’s trajectory. As Bitcoin consolidates or experiences minor retracements, ETH and peers are likely to follow suit. Traders should weigh these altcoin setups against prevailing Bitcoin momentum for confirmation.
Market Dominance Trends

Stablecoin dominance has dropped to oversold territory and printed a daily TBO open-short signal. Historical TBO breakdowns accompanied by TBT bullish divergence on the 4-hour chart have preceded temporary reversals, suggesting a bounce could be imminent—though a decisive break below the 5.58% support level may signal a parabolic move toward a bull-market peak.
Bitcoin dominance remains in bullish consolidation within the daily TBO cloud, yet has yet to challenge the weekly fast line at 60.25%. Ethereum, Solana, and other category dominances are still in consolidation phases but show early signs of breakout potential. Total market cap dominance on the weekly chart exhibits bearish divergences and volume topping at key resistance, hinting that the broader rally may be approaching a critical juncture.
Traditional Finance and Gold

The US dollar index printed a TBO close-short signal on its daily chart, marking another potential bullish reversal that could pressure risk assets. Meanwhile, the S&P 500 trades at the 1.272 Fibonacci extension of this year’s tariff-sell-off range and recently formed a breakout cluster—raising the possibility of further gains toward 7,500, particularly in a historically bullish Q4 environment. Low VIX levels suggest minimal investor fear, and the Nikkei surged over 4% on pro-Japan political developments.
Gold continues its rally, with a daily RSI of 89.63 just shy of the 90.20 local high. A sustained move above that level would open the path for significantly higher prices, reinforcing gold’s role as a hedge amid persistent global uncertainty.
Altcoin Highlights

BNB has broken above $1,200 and eyes the $1,500 area. Cardano is testing long-term resistance with a daily TBO open-long signal; a close above that level would confirm bullish continuation. Chainlink has pierced key resistance levels, while TAO’s 10% pump remains within a broader consolidation zone. MNT rallied 25% following a 4-hour TBO breakout cluster, and XPL is up 25% since bouncing from TBO support on the 4-hour chart.
Key large-cap alts such as APT and PENGU face overhead hurdles, and XDC’s fifth daily TBT bullish divergence cluster has yet to trigger a significant move. Traders should watch whether Bitcoin’s anticipated short-term pullback materializes, as this will likely dictate temporary performance across the altcoin sector.
Learn my strategies and the tools I use every day by visiting The Complete Cryptocurrency Investor by Mastering Assets.