

BTC Technical Setup

Bitcoin encountered resistance at the TBO Cloud on the daily chart near $124,000, prompting a pullback despite its maintained position above the Cloud. On the 4-hour chart, a TBO Breakout cluster remains valid, although a fresh TBT Bearish Divergence preceded the decline. Weekly data also indicate an in-progress TBT Bearish Divergence, suggesting we may be approaching the late stages of this bull cycle. That said, history shows BTC can still rally after initial bearish divergence signals; our intermediate target remains near $150,000 by mid-November.

Volume and Momentum Indicators

Daily on-balance volume (OBV) continues to exceed its moving average, reinforcing overall buying pressure, while daily volume surpassed the long-term moving average line. However, daily RSI carrying a lower high at 84.8 versus 86.7 in July signals bearish divergence against price. Weekly OBV has fallen below its MA, mirroring patterns seen in past summer corrections, and weekly volume has declined since last November. We have yet to see a TBO weekly Close Long (“Bear Formula”) at the Fast line near $112,000, but such a signal typically arrives late in a cycle.
Market Dominance Metrics
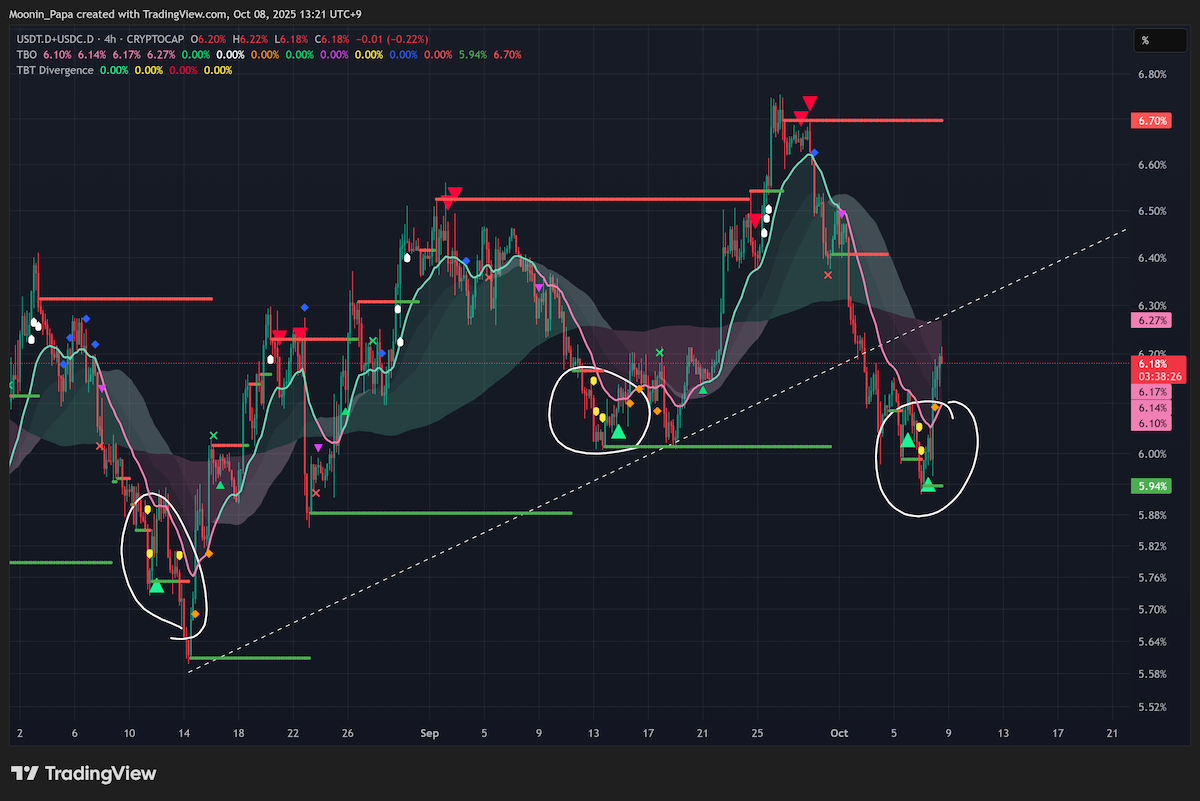
Combined stablecoin dominance spiked by 4.7%, indicating a short-term pullback rather than a deeper liquidation. Bitcoin dominance remains in bullish consolidation within its daily TBO Cloud, targeting a move toward 61%. In contrast, Ethereum and Solana dominance charts show weakness—SOL.D confirmed a TBO Cross Down—while OTHERS.D closed below support. If Bitcoin reclaims $126,000, we expect stablecoin dominance to fade back toward 5% before rising into next year’s bear market.
Macro and TradFi Correlations

The US dollar index (DXY) is trading above its 0.618 Fibonacci retracement and is on the verge of a TBO Open Long, a first since October 2024. S&P 500 futures remain near the 1.272 Fibonacci extension and have yet to reflect dollar strength. Meanwhile, the FANG index posted a second TBT Bearish Divergence, and Nvidia is printing a similar weekly divergence. The VIX is gradually moving higher, signaling increased volatility risk across asset classes.
Gold Market Signals

Gold surged through $4,000, with daily RSI marking a 90.8 high—an extreme parabolic move. Historically, parabolic advances in gold have led to steep corrections, and this outlier performance warns of potential systemic stress or “everything bubble” dynamics. Traders should be aware that while gold is often a safe-haven during turmoil, such euphoric price action can reverse rapidly.
Altcoin Market Review

Ethereum reclaimed the daily TBO Cloud but remains below resistance, with RSI printing a fresh lower high. XRP was rejected at its resistance fan after multiple tests. BNB hit a new high near $1,350 en route to $1,538 next. SOL dropped into its TBO Cloud, entering bearish consolidation. LINK and SUI also faced rejections at key levels, while AVAX formed a TBO Close Long on the pullback. Notable outliers include ZORA, which printed a second TBT Bullish Divergence, and TST, which posted a 15% gain with above-average volume. WLFI saw a 13% sell-off and two 4-hour TBO breakdowns, indicating further consolidation ahead.
Learn my strategies and the tools I use every day by visiting The Complete Cryptocurrency Investor by Mastering Assets.