

Bitcoin Price Action and Technical Signals

Bitcoin’s recent lower wick on the daily candle suggests a corrective move toward the daily Fast line, echoing similar patterns in August and September where a Springboard Bounce occurred. While the daily RSI is trending lower, both On-Balance Volume and total volume remain robust above their moving averages. The price is still trading above the daily TBO Cloud, which technically maintains a bullish posture despite short-term weakness.
On the weekly chart, a TBT Bearish Divergence is in progress. Should a second divergence form in the coming weeks, it would reinforce the possibility of a market top in mid-November and a subsequent shift toward a bear phase in early 2026. Investors are reminded of past missteps, such as late-cycle optimism in November 2021, and are advised to define clear scaling-out strategies, relying on simple volume and RSI signals rather than lagging metrics like MVRV or the Puell Multiple.

Ethereum Outlook and Chart Patterns

Ethereum’s daily chart shows a retreat into the TBO Cloud after failing to hold above short-term resistance. On the 4-hour timeframe, a third clustered TBO Close Long has appeared, typically a bearish sign in a tight range, suggesting a potential drop toward $3,950 over the weekend. The ETH/BTC pair remains in bearish consolidation, underscoring continued underperformance relative to Bitcoin.
Market Dominance and Capital Flows
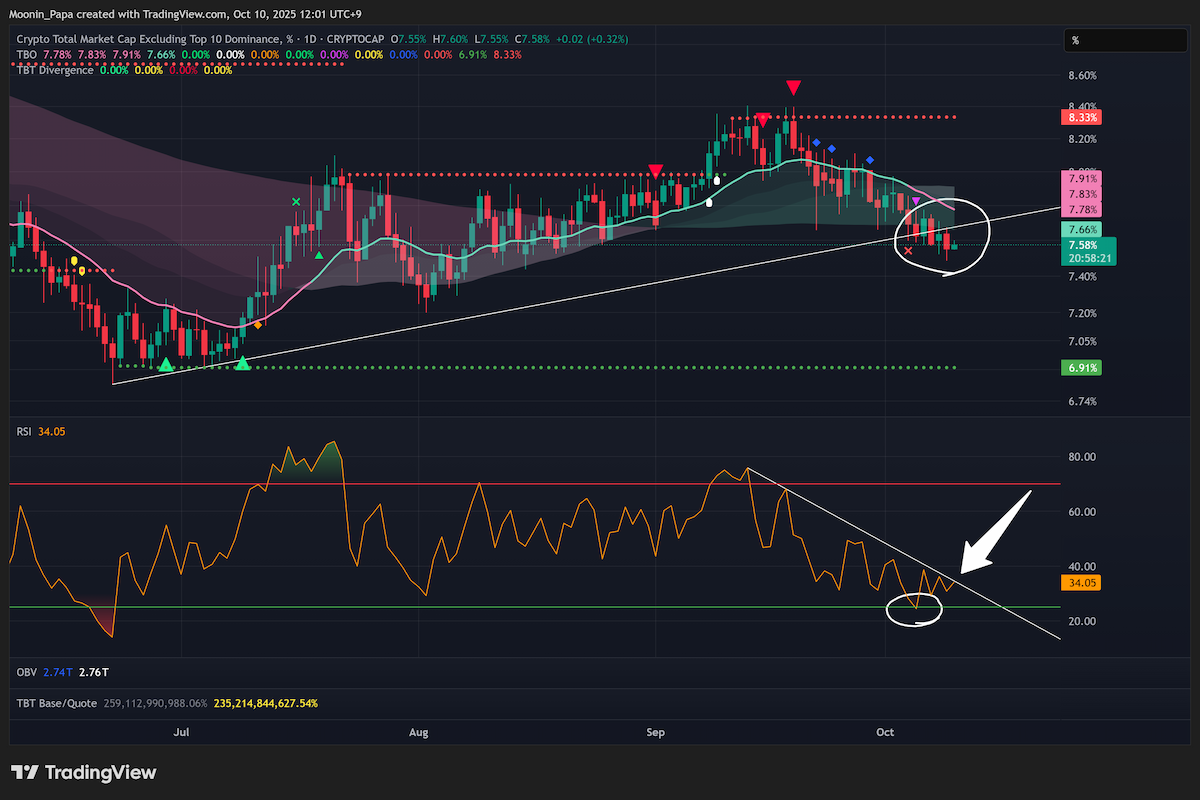
Combined stablecoin dominance has pierced its former support and is climbing, exerting pressure on altcoins. While a pullback at the TBO Fast line could materialize, conditions must change dramatically for it to reverse. The daily STABLE.C.D chart suggests further upside before testing prior lows. Meanwhile, Bitcoin Dominance established a local higher high at 59.41% and looks set to challenge 61%, a move that would likely intensify short-term selling pressure on altcoins.
Other protocols dominance (OTHERS.D) remains bearish below the daily TBO Cloud despite a minor RSI reset hinting at a possible relief bounce. The TOTALES.D weekly chart is printing a TBT Bearish Divergence cluster akin to the April 2021 and 2018 tops, with weekly RSI making lower highs since November 2024. Though hidden bearish divergence may not preclude further gains, these signals underscore that this bull cycle may be in its final stretch.
Traditional Finance, Gold, and Macro Indicators

The US Dollar Index closed above its daily TBO Cloud, gaining 0.58%—a notable move for the DXY—while its weekly chart has entered the TBO Cloud for the first time since October 2024. Major equity indices (S&P 500, Dow Jones, Nasdaq) continue to show no immediate technical warning signs, and the VIX remains subdued. Gold, however, posted significant gains amid speculation that a newly announced Israel-Gaza peace treaty may reduce geopolitical risk, potentially marking a short-term top for the metal. Broader concerns over rising unemployment and slowing consumer spending in the US warrant close attention.
Altcoin Highlights and Key Levels
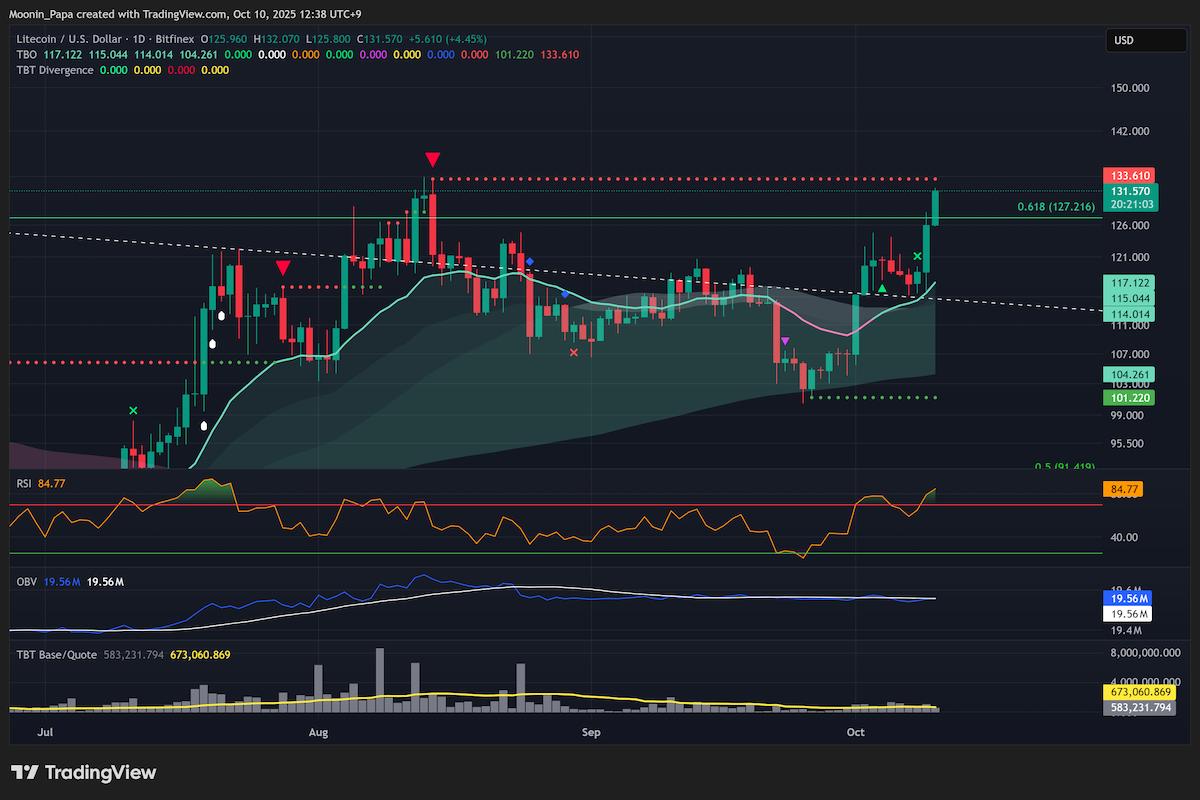
XRP and SOL are consolidating within their daily TBO Clouds, with XRP dipping into bearish territory and SOL displaying declining volume. BNB suffered a 4% pullback as RSI formed lower highs against rising price. LTC’s 6% surge targets TBO resistance at $133, while UNI is setting up a TBT Bullish Divergence cluster. SUI and ASTER are testing critical support levels, and TAO is challenging overhead resistance. MNT’s recent 13% drop and APT’s tentative Springboard Bounce require confirmation before contrarians consider entries. Notably, ZORA’s 72% wick-to-wick move has propelled it above its 0.618 Fibonacci retracement level, although consolidation may continue.
Learn my strategies and the tools I use every day by visiting The Complete Cryptocurrency Investor by Mastering Assets.