

Bitcoin Technical Outlook

Bitcoin’s chart posted another 2% drop but maintained a higher low, signaling underlying demand despite a bearish close below the daily TBO Cloud. Daily volume remains above its moving average, reinforcing participation, yet the absence of bullish reversal signals on the 4-hour chart suggests sellers retain control.
The near-term objective is for BTC to test the daily TBO Fast line near $115,500—a level that would also coincide with short-term overhead resistance and the top of the cloud. A successful tag of this line would “close” last Friday’s TBO Close Long signal and potentially set the stage for a move toward $130,000 by month-end.

Ethereum Chart Behavior

Ethereum suffered a 3.4% decline but similarly held a higher low, reflecting buying support around the $4,000 area. Persistent higher lows across both BTC and ETH denote strong bids at key levels, suggesting the market deems current prices attractive.
If Bitcoin achieves the expected 17% rally to $130,000, ETH is likely to follow, potentially challenging $5,000. However, traders should monitor for concrete bullish reversal signals before scaling exposure.
Market Capitalization and Dominance Metrics
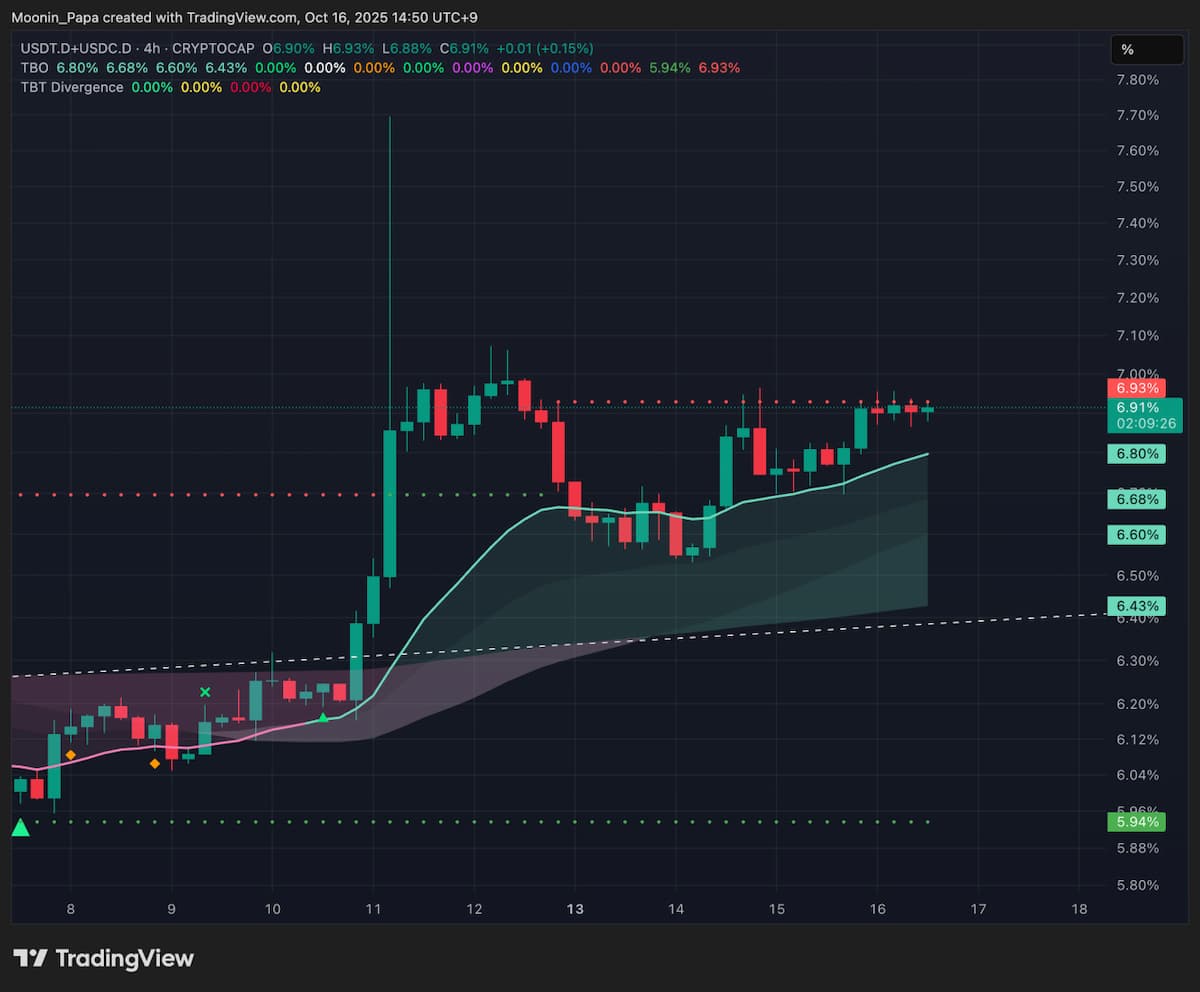
Combined stablecoin dominance shows early signs of weakening, with the daily RSI rolling over. A green close in BTC could trigger a red candle in stablecoin dominance, setting up a potential decline toward 6%, or a 13% retracement from current levels. Although 4-hour bearish reversal signals remain absent, they may emerge soon.
Bitcoin dominance’s daily RSI is waning, yet a push toward 61% remains plausible. Ethereum dominance, having broken short-term resistance, exhibits a hidden bullish divergence with RSI, which supports expectations for further gains. Other sector indices, including small-caps (TOTALE100), are already flashing 4-hour bullish reversal signals.
Macro Influences and TradFi Correlations
Recent US-China trade war rhetoric—tariffs and market interventions—has surprisingly impacted crypto volatility despite the asset class’s decentralized nature. This response underscores crypto’s sensitivity to global liquidity “waves,” even when fundamentals appear unrelated to traditional finance.
Crypto market cap remains a small fraction of global liquidity, magnifying its susceptibility to geopolitical and macroeconomic events. Traders should remain vigilant to external news catalysts that may override on-chain technical patterns.
Altcoin Technical Signals

Numerous altcoins are presenting short-term technical setups. BNB retraced to its daily TBO Fast line after a second 4-hour bearish divergence, suggesting a possible springboard bounce toward $1,375, albeit amid weakening volume and RSI. SOL sits at price-based support within a bull flag, requiring renewed volume to confirm an upside breakout.
LINK is in the process of printing a second hourly bullish divergence, targeting $20, while pairs such as HYPE, ICP, and KAS are also tracing TBT bullish divergences on lower timeframes. Although altcoins display promising pivot signals, broader market confirmation via BTC’s move to $115,500 is essential to sustain a sector-wide recovery.
Learn my strategies and the tools I use every day by visiting The Complete Cryptocurrency Investor by Mastering Assets.