
Strengths
- The best performing commodity for the week was platinum, but still down 1.58%, despite surging over 6% to $1,646/oz earlier in the week, its biggest intraday gain since 2020, as China ended a long-standing VAT rebate that distorted imports and triggered a rush for physical metal. With a structural supply deficit and rising demand from China’s jewelry and hydrogen sectors, platinum stands out as a point of strength among precious metals despite broader market volatility.
- Japan Physical Gold ETF plunged as much as 6.7%, the most since April 2013, after Tokyo Stock Exchange said investors should pay attention to its net asset value as it’s been consistently trading at a premium, according to Bloomberg.
- A relentless surge in the price of gold is delivering windfalls across emerging markets, boosting investor confidence in countries that mine and buy the metal. In South Africa, home to the world’s deepest gold mines, stocks are on track for the best year in two decades, with shares of miners like Sibanye Stillwater, AngloGold Ashanti and Gold Fields tripling in value, according to Bloomberg.
Weaknesses
- The worst performing precious metals this week was palladium taking a 3.83% hit with the precious metal’s correction this week. Norilsk Nickel’s palladium output fell 9% year-on-year in Q3 to 617,000 ounces as operational transitions and ore changes disrupted production. The decline underscores ongoing weakness in palladium supply growth, with full-year guidance trimmed and limited recovery expected amid equipment upgrades and lower-grade ore.
- Gold and silver slid as traders took stock of record-breaking rallies, with technical indicators looking stretched while U.S.-China tensions ease. Gold’s ferocious rally has measures like relative strength indicating that prices have passed well into overbought territory. A strengthening US dollar has also made precious metals more expensive for most buyers, according to Bloomberg.
- Newmont shares sold off following the earnings release as analysts cautioned that the company may be leaning too heavily on gold price momentum rather than demonstrating strong operational execution or near-term production growth. While free cash flow and EPS handily beat expectations, BMO noted that guidance still reflects stagnant production through 2026, leaving investors concerned about limited organic growth catalysts despite solid cost control and shareholder returns.
Opportunities
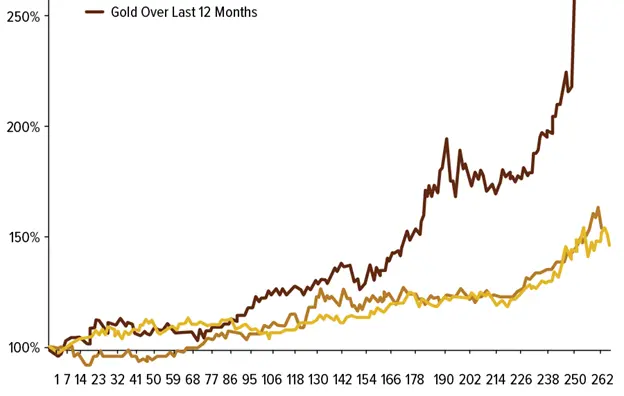
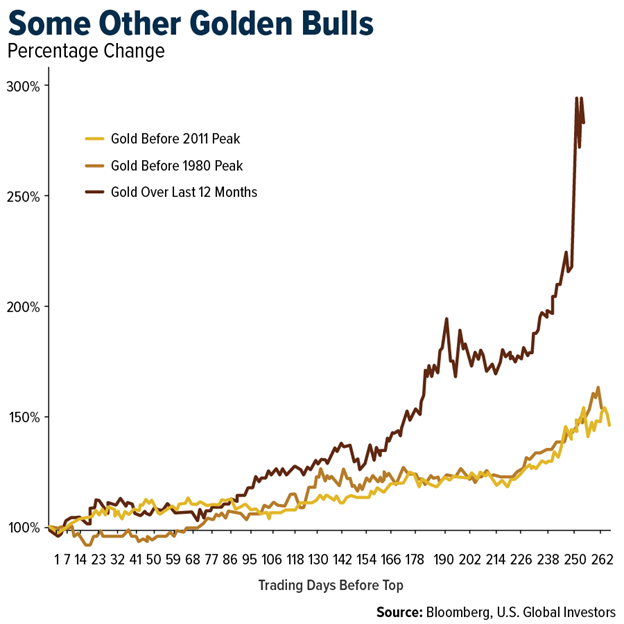
- John Authers’ column this week on Bloomberg looked at past bull markets in gold, to put the recent correction into context. “It’s useful to compare with the last two great bull markets, which peaked in January 1980 at the depths of fears over eternal stagflation, and in September 2011 after Standard & Poor’s had downgraded U.S. Treasuries’ credit rating. This bull market looks very much like 2011 and nothing like 1980.” In January of 1980, the Soviet Union had just invaded Afghanistan, there were US hostages in Tehran, the Federal Reserve was hiking rates, US stocks were deep in a bear market, and all hope had been lost. This gold rally has coincided with what many describe as a stock market bubble. Looking more closely at 2011, and at the very different behavior of stocks, reveals more differences. Back then, S&P triggered an extreme “debasement trade” with the downgrading of the U.S. credit rating from AAA to AA+. Within weeks, the world was still turning, it was apparent that the QE bond purchases of the era hadn’t sparked inflation, and a fresh equity bull market was underway. This time, gold has outperformed a booming stock market, and there was no clear triggering event like the downgrade to get people talking about debasement.
- The long-term outlook for platinum metals demand remains highly uncertain and processing capacity in the industry is constrained, which Bank of America believes will hold back investment into greenfield assets. While brownfield life extension options will allow for replenishment, the more capital constrained industry could lead to more rational behavior by South African miners and potentially less volatility in future capital cycles. In their view, this could potentially drive a tighter market long-term.
- IAMGOLD announced its acquisition of Northern Superior Resources and Mines D'Or Quebec for C$375M and C$17.2M, respectively. These acquisitions consolidate IMG's land ownership around its Nelligan and Monster Lake projects, creating the Nelligan Mining Complex with 3.75Moz M&I and 8.65Moz inferred resources, according to BMO.
Threats
- According to BloombergNEF, the cost of silver in a solar module has now overtaken aluminum, making silver the single largest contributor to module costs at 17% of the total. This compares to 3% of the total cost in 2023. Silver is up 79% YTD, driven by tight supply, rising ETF demand and more recently a physical squeeze, according to Morgan Stanley.
- According to RBC, larger corrections for gold are typical in bull markets—in the current cycle that started in 2022, there have already been 7 corrections greater than 5% which have each lasted an average of 70 days and with drawdowns of a median -7%. Correction periods of >5% for gold represented a median drawdown of -8% and occurred over an average 103 days, which if compared to recent highs could represent a decline in prices of $337/ounce to arrive at $4,019/ounce.
- Paired with the above argument, this sounds like over the next couple of months investors should look elsewhere for better market returns than gold has to offer. There is a perception that with lower energy prices and the backdrop for falling interest rates this is going to benefit the broader equity markets, and you don’t need gold. However, the budget impasse is still unresolved with no clear side showing the willingness to cave, there is still a lot of risks to hedge.