

Bitcoin Price Technical Outlook
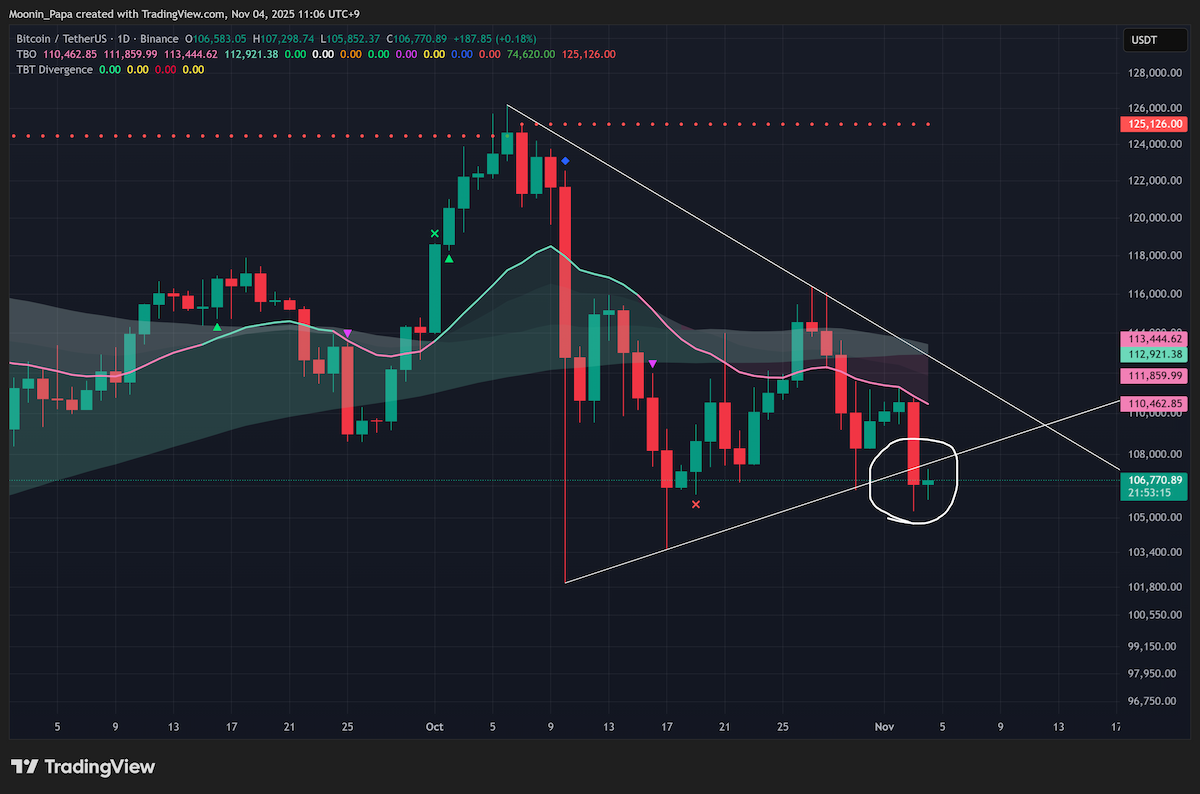
Bitcoin’s recent 3.58% decline breached short-term support and printed a TBO Breakdown on the 4-hour chart, raising the risk of further downside if $108,000 is not reclaimed. Historically, November tends to close bullish, and the market’s anticipated peak this month aligns with expectations set late in 2023. However, weekly charts already issued a TBT Bearish Divergence four weeks ago, and both weekly RSI and On-Balance Volume (OBV) are trending lower. Re-entry into the weekly TBO Cloud underscores a bearish consolidation phase.
Absent a decisive recovery above $108,000, the broader bear market target remains $35,000 by its projected November 2026 trough. Traders uneasy with current volatility may consider scaling out of positions; some profit-taking around $120,000 has already been executed in line with disciplined risk management.

Dominance Metrics and Market Structure

Combined stablecoin dominance produced a 4-hour TBO Breakout on the recent pullback—often a topping signal foreshadowing a limited relief rally. Yet daily RSI is diverging lower against rising prices, suggesting a protracted pullback akin to August–November 2024’s 90-day pattern. On the weekly timeframe, stablecoin dominance nears the bear market confirmation zone, with no daily bearish reversals (TBT Divergences or TBO Close Longs) to avert further gains.
Bitcoin Dominance (BTC.D) surged to approximately 60.68%, just below the 61% threshold, and printed a daily RSI lower high at 77.73 versus October. A 4-hour TBO Breakout Cluster adds both topping and continuation implications, underscoring the potential for continued BTC.D strength while cautioning on a near-term peak. Altcoin dominance suffered a commensurate decline.
Market Capitalization Trends and Alt vs. BTC Performance

The total crypto market cap (TOTALES) is testing a setup similar to late September: a TBO Breakdown cluster followed by a TBT Bullish Divergence cluster, a TBO Close Short, and an ensuing 11% rally. Should Bitcoin retake $108,000, a comparable recovery may unfold. Other segments remain severely oversold, but broader capitulation hinges on Bitcoin’s support reclaim.
The OTHERS/BTC weekly chart shows RSI dipping below 25—traditionally signaling sustained downward pressure rather than an immediate bounce—even as daily TBT Bullish Divergences emerge. This dynamic suggests further underperformance of alt-heavy market caps versus Bitcoin.
Macro Environment: FX and Equity Indicators

The US Dollar Index (DXY) sits firmly above the daily TBO Cloud, confirming strong bullish conditions. A close above October’s RSI peak of 79.17 would validate further upside, intensifying headwinds for equities and currency markets. Weekly RSI also exceeds 70, and a recent 4-hour TBO Breakout Cluster supports continued strength. The Japanese yen is testing critical resistance—breaches here could force Bank of Japan intervention to safeguard trade relations.
In equities, weekly “shooting star” candles on the DJI and NDX represent classic topping signals, though their daily and weekly frameworks remain bullish, underpinned by low VIX readings. The Nikkei has reached its 1.618 Fibonacci extension—often a terminal zone for uptrends—while the Shanghai Composite holds support and the Hang Seng re-tests its daily TBO Cloud resistance.
Gold Market Analysis

Gold’s rally stalled beneath the daily TBO Cloud, shifting into bearish consolidation likely to persist for several months. The daily RSI has fallen into the low 40s, On-Balance Volume crossed below its moving average last week, and trading volume has contracted. Despite these bearish technicals, any significant geopolitical or economic crisis could swiftly reverse the trend and drive renewed inflows into gold.
Select Altcoin Opportunities and Cautionary Signals

Post-sell-off setups vary across altcoins. BNB found support at its 1.272 Fibonacci extension with daily RSI oversold; a move above 25 RSI would mark its first reset since June. SOL dipped below its 0.5 retracement, offering short-term scalps on oversold readings. XRP and COAI show early bullish RSI resets and volume spikes, while XPL has formed a double-bottom above October lows. ASTER’s local double-bottom and ICP’s reclaiming of historical TBO support warrant close monitoring.
Conversely, TRX and LINK printed daily TBO Breakdowns, indicating potential further declines—though breakdown clusters in major sell-offs can sometimes foreshadow capitulation lows. ZEC, DASH, and ZEN defied the broader downtrend with double-digit gains, but these pockets of strength remain contingent on Bitcoin’s ability to retake $108,000 to catalyze a broader market recovery.
Learn my strategies and the tools I use every day by visiting The Complete Cryptocurrency Investor by Mastering Assets.