

Bitcoin Price Action and Technical Indicators
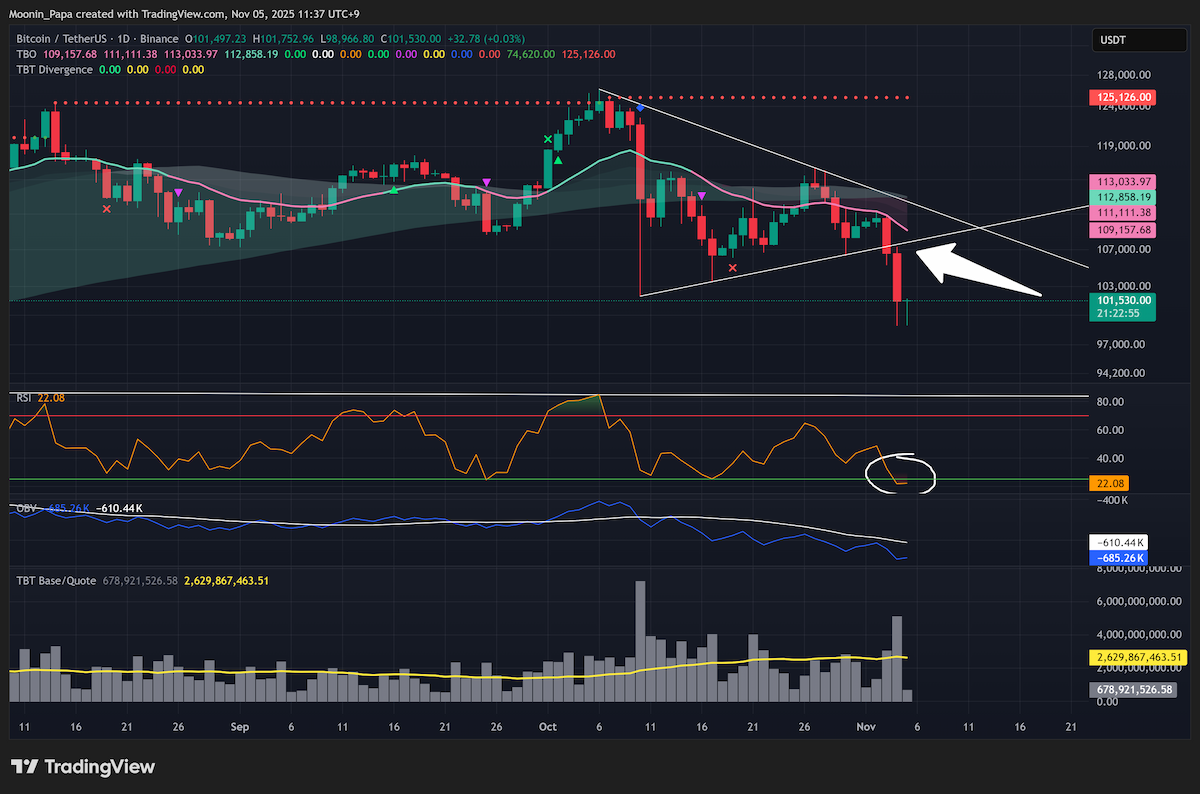
Bitcoin tested short-term support near $106,000 before capitulating yesterday with elevated volume, dipping as low as $98,000. The daily RSI plunged to 21.89, signaling extreme oversold conditions and the possibility of an RSI reset should BTC close today in green. On the 4-hour chart, the recent TBO Breakdown Cluster accurately anticipated this decline, while a weekly TBO Close Long is forming—echoing the bottoms of September 2024 and April 2025—though late-stage bull market timing warrants caution.

Ethereum and Stablecoin Dominance Dynamics
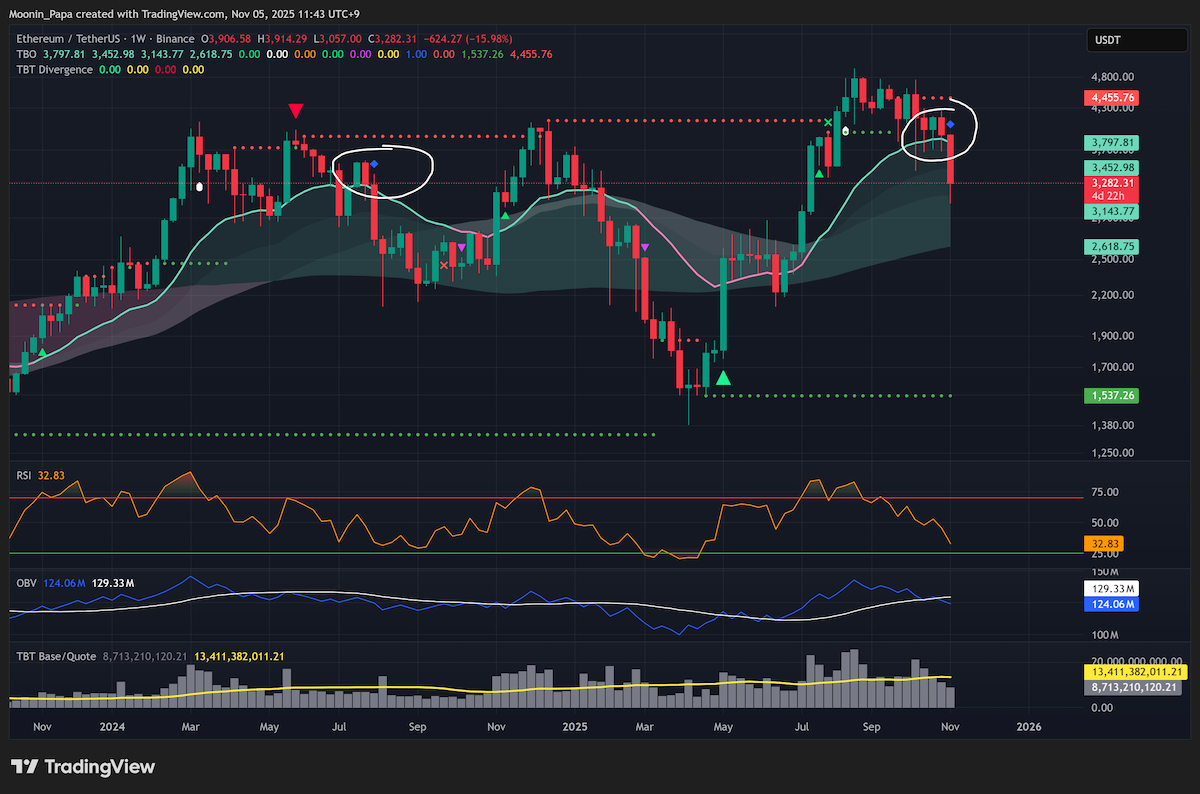
Ethereum’s weekly chart is also in the process of printing a TBO Close Long, but the previous formation preceded a further drawdown toward $1,380. Combined stablecoin dominance printed a daily TBO Breakout with an RSI high of 80.58, entering a “bear market zone” historically associated with high-fear events such as the August 2024 Nikkei crash and the April 2025 tariff-induced sell-off. The absence of relief signals—no TBT bearish divergences or weekly TBO Close Longs—suggests continued pressure on stablecoin metrics.
Bitcoin Dominance and Altmarket Cap Trends
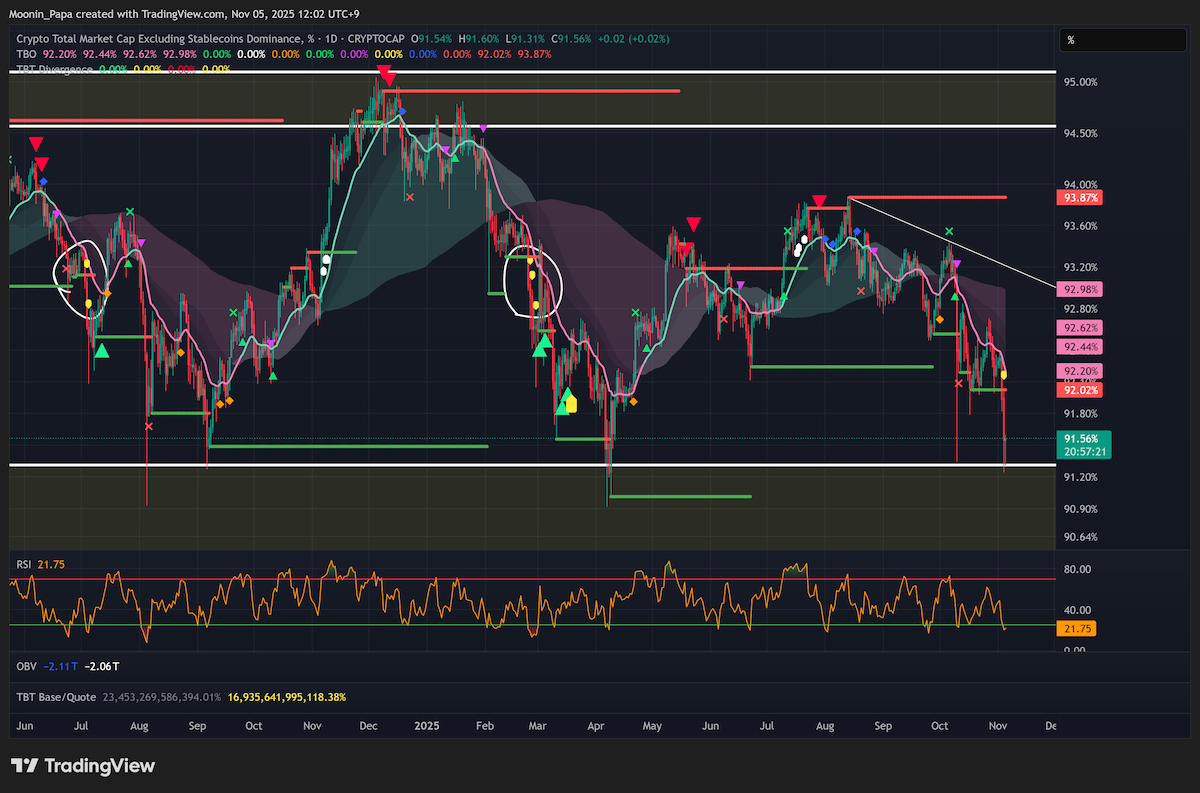
Bitcoin dominance (BTC.D) rose to 61.41% on the recent pullback, with daily RSI recording a slight higher high at 78.07 but failing to sustain above TBO resistance. Weekly RSI remains above its overhead resistance, indicating short-term bullish momentum. Conversely, total market dominance (TOTALES.D) confirmed a daily TBO Breakdown during this sell-off and shows no daily bullish reversal signals, while staying below the weekly Ichimoku cloud, underscoring a bearish posture for broad market share.
Market Cap Signals and Early Selective Altcoin Rally
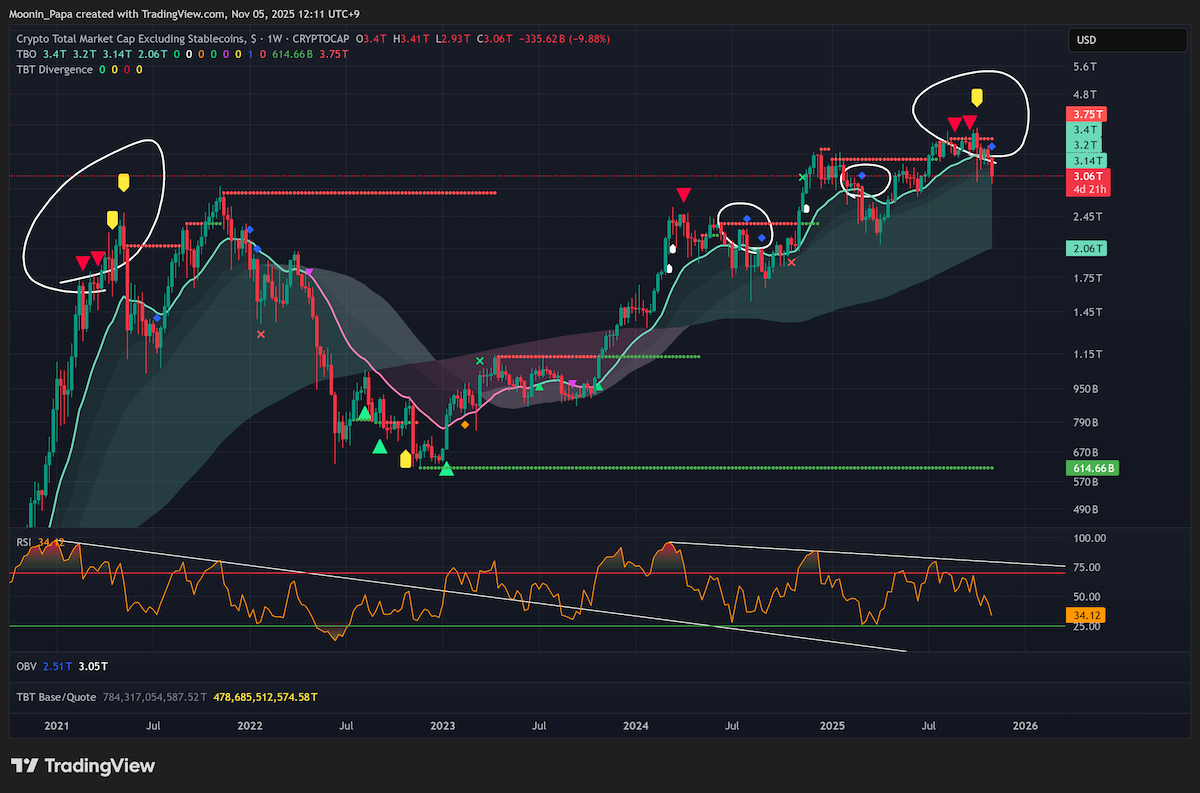
The total market cap (TOTALES) is deeply oversold on the daily chart and set for an RSI reset, yet remains beneath the daily TBO Cloud in “strong bearish” mode. Its weekly chart is shaping another TBO Close Long, mirroring bearish divergence clusters from early 2021. Nonetheless, I maintain conviction in a selective altcoin rally to close the year; breakouts in ZEC, DASH, and ICP, alongside valid TBT bullish divergences on the OTHERS/BTC and TOTAL3ESBTC charts, highlight targeted opportunities despite broader weakness.
Traditional Finance and Macro Influences
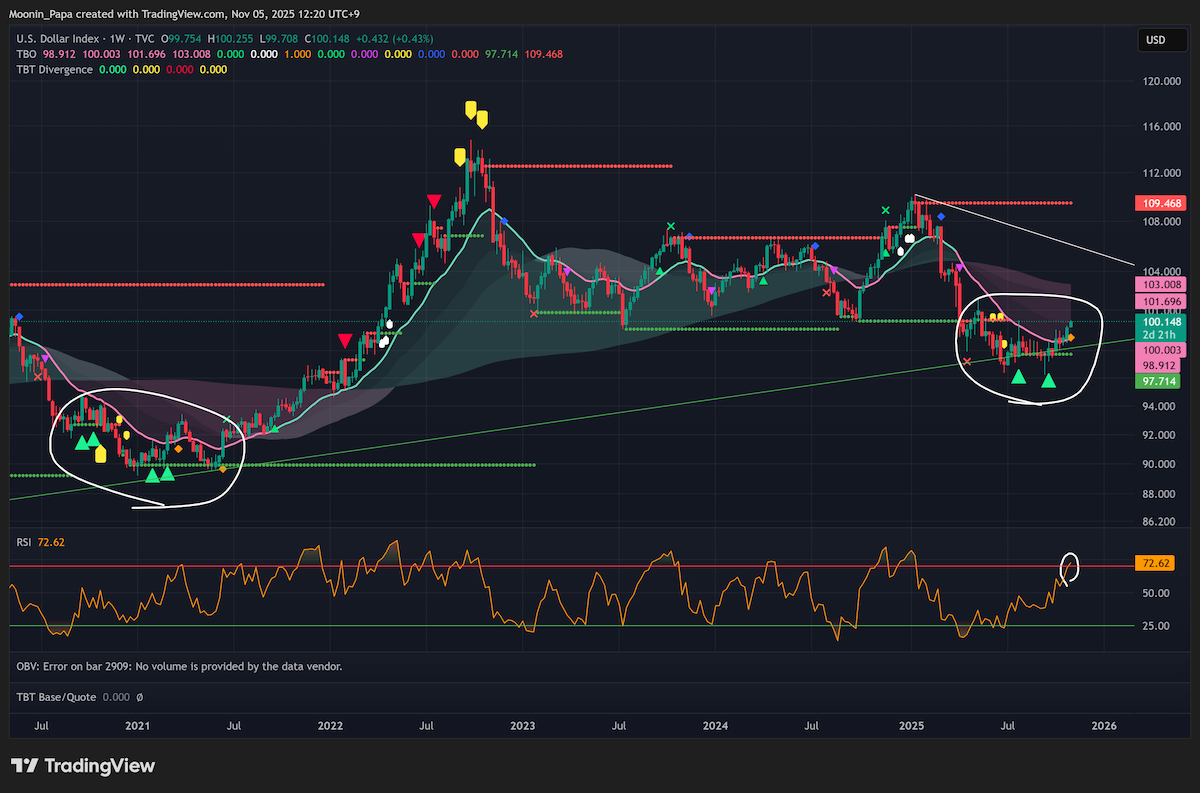
The U.S. dollar index (DXY) has rallied to TBO resistance just above 100, printing five consecutive green daily candles and the highest RSI since January. A weekly TBO Close Short is in progress with overbought RSI, echoing the early-2021 setup that preceded a rally to 114. A stronger dollar typically burdens FX pairs, U.S. equities, and crypto. S&P futures are down, forming a second TBT bearish divergence, while the Nikkei and Hang Seng display overbought weekly RSI and bearish divergences—signaling further macro headwinds. Gold remains in bearish consolidation, though increasing fear often underpins its safe-haven bid.
Short-Selling Strategies for the Evolving Market
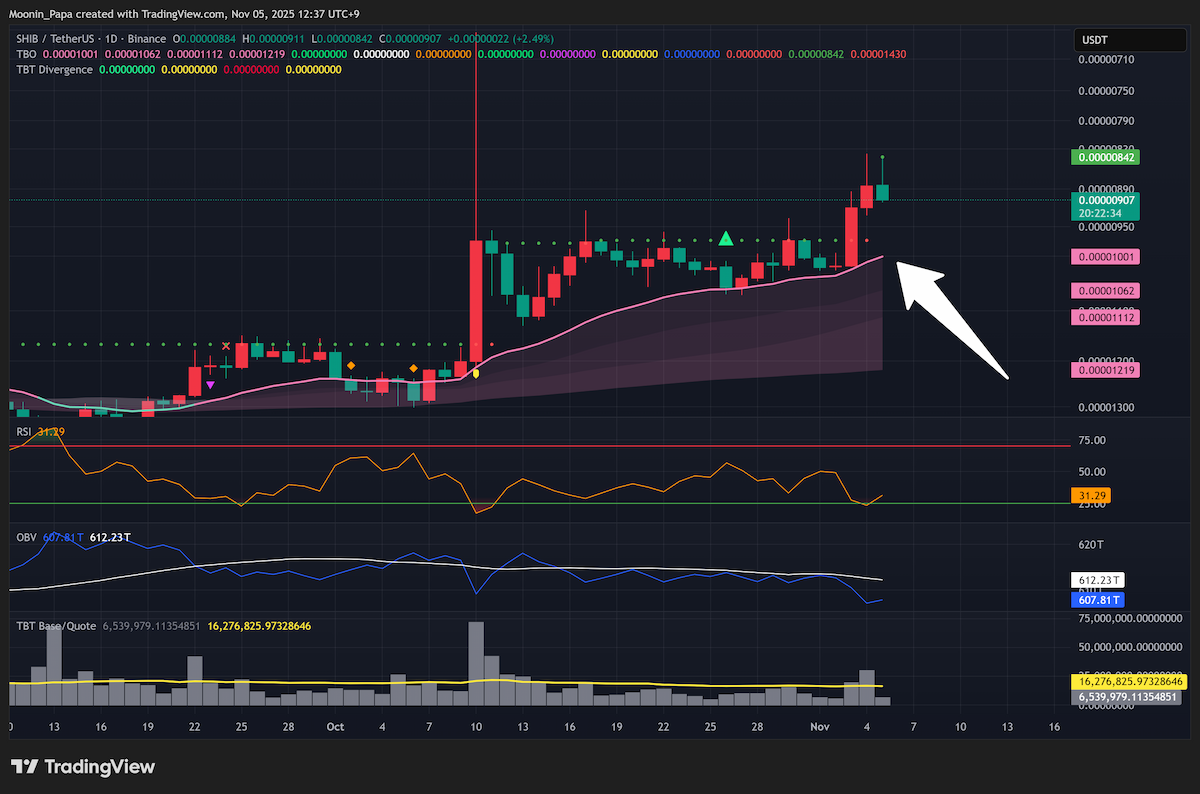
With a bull-to-bear transition likely, refining short-selling strategies is essential. Invert your TradingView chart and apply the TBO Cloud to identify entries analogous to bullish setups. Monitor the daily TBO Slow line’s direction for trend-aligned bounces, and use backtesting tools in TradingView or Altrady to develop proficiency. Meme-based tokens, lacking fundamental utility, often suffer the deepest declines during protracted sell-offs—offering asymmetrical risk-reward profiles for prepared traders.
Learn my strategies and the tools I use every day by visiting The Complete Cryptocurrency Investor by Mastering Assets