Nov 11, 2025
1. I volunteered for the Navy as a teenager, not to be a hero, but to get over my fear of being killed, maimed, or emotionally ruined in a war. Thankfully, I never saw any action, but many brave citizens did. Horrifically, governments enjoy glorifying some of their debt-funded wars while gleefully ignoring others.
2. Draft dodgers sometimes become chickenhawks that eagerly promote the madness. That creates a vicious cycle…
3. A cycle much like the never-ending war of debt-oriented fiat versus supreme money gold.
4. Clearly, fiat isn’t faring well. Over the past 55 years, there have only been four times where this vile “wannabe money” has managed to rally against gold, and only one of them could be termed a bull market for fiat (1980-2000).

5. I’ve predicted that there could be a brief bull run of significance for fiat, in 2029. That year marks the 100th anniversary of the 1929 stock market crash, which was followed with the infamous confiscation of gold.
6. After their gold was taken away, US citizens were ordered to fight for debt and fiat-oriented freedom in World War Two.
7. The 100year anniversary of 1929 probably plays out something like the 2008 crash did, when gold quickly resumed its long-term mauling of government fiat.
8. I’ll note that this mauling is becoming more Asian-themed by the day. As the gargantuan gold-oriented populations of China and India get a higher standard of living, their already-enormous demand for gold could rise exponentially.
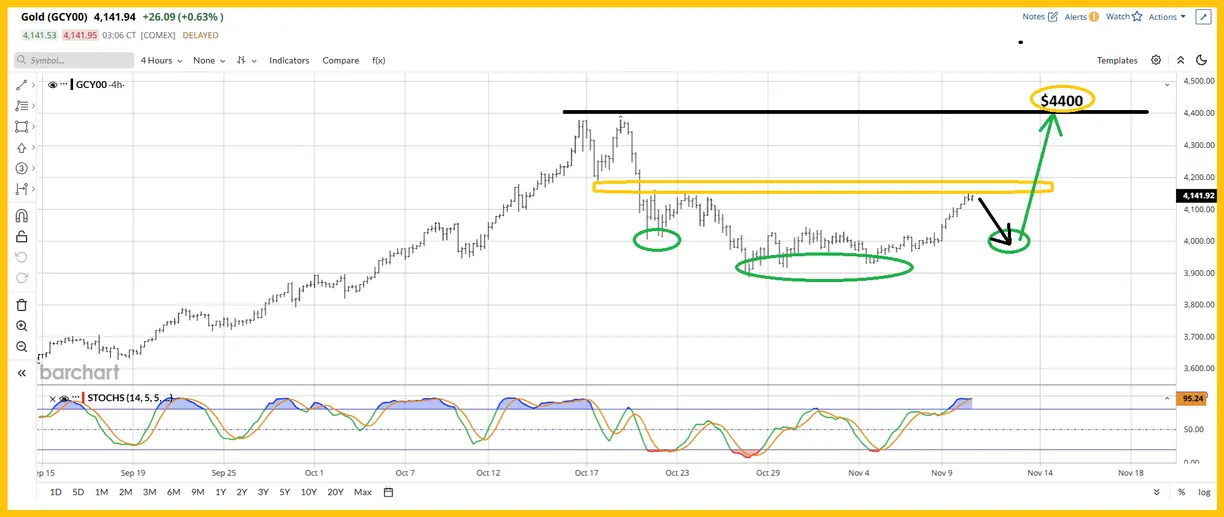
9. Click to enlarge this enticing short-term chart for gold versus US fiat. A significant inverse H&S pattern appears to be forming, targeting the $4400 area highs.

10. In this highly likely scenario, gold pulls back from $4400 to about $4200 and a larger inverse H&S pattern takes shape.

11. That pullback should be followed with a glorious rally to the big round number zone of $5000.
12. Tuesdays are often a soft day for gold. Some conspiracy buffs refer to it as “Takedown Tuesday”. It’s true that the big sell-off from $4380 on October 21 did occur on a Tuesday but...
13. My suggestion for investors is to focus on the awesomeness of gold and leave the debate about government and bank interference in the market to others.
14. The focus should be on getting more gold in key zones for action, regardless of what event puts the price into those zones.
15. What about silver? Silver looks technically superb. There is also substantial inverse H&S formation in play, and the target of the pattern appears to be about $62.

16. If the target zone is hit, the $54-$50 area likely becomes a massive “floor of sustenance” for higher prices… prices that should put some very large smiles on a lot of very patient silver bugs.
17. For a key view of the miners. Click to enlarge this phenomenal short-term chart for the CDNX index. A reaction was expected as it rose to the vital 1000 round number zone.That reaction has occurred and it’s been healthy; volume rose on the surge into 1000, and it has tapered as the price action has softened.

18. Also, note the fabulous position of the Stochastics oscillator. MACD looks good too, and the key TRIX indicator has arrived at its zero zone… where huge rallies often begin.
19. Junior mine stock investing isn’t for everyone, especially with size, but as this gargantuan gold bull era rollout continues, these miners look set to outperform everything.
20. Click to enlarge this exciting GDX daily chart. I urged gamblers and aggressive investors to buy a 50% retracement of the gold stocks rally from $3500 gold and on that note…

21. Click to enlarge this key dividend-stripped GDX chart. The 50% retracement put GDX at the 2011 highs of about $67.

22. The bottom line is that the move to $85 is turning the $67 area into the biggest “floor of sustenance” in the history of gold stocks.A further move up to $100 (my target is $110 for GDX at gold $5000) really locks that in.
23. A move above $85 for GDX is also likely to coincide with a massive breakout from the huge inverse H&S pattern on this long-term GDX versus gold chart.

24. It’s unlikely that the big Elliot C wave for GDX on this chart ends until gold trades close to $10,000. Where could GDX trade then? Well, numbers like $200 and $300 are realistic projections. In a nutshell, to fully answer this question, space helmets may be required!
Thanks!