
Gold has recently established a structural floor around $4,000 per ounce, even following a sharp correction from new highs. That persistence signals a definitive change in what underpins the market. The drivers are increasingly structural with mine output growing at its slowest pace in a decade, extraction costs rising, and exploration capital retreating. Together they form a scarcity premium embedded in price stability.
Unlike previous cycles defined by liquidity and monetary policy, 2025’s gold market reflects the fundamentals of constrained supply. The world’s largest producers are managing aging deposits and tighter environmental standards that restrict new output.
Investor and central-bank demand remain relevant, but the deeper resilience now comes from the ground itself, a quiet tightening that is reshaping gold’s long-term equilibrium.
Global Mine Output Is Nearing a Plateau
The global supply side of the gold market is approaching its physical limit. World Gold Council data show total mine production rising just 1% in 2024 to 3,661 tonnes, a new record but the slowest expansion in more than ten years. That marginal gain contrasts sharply with the pace of investment and central-bank accumulation that pushed total gold demand to 4,974 tonnes in the same year.
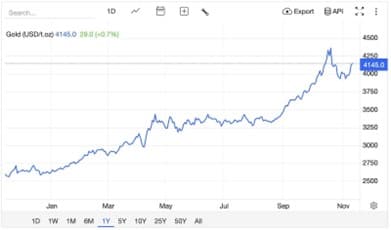
Chart: Gold Price (USD per Troy Ounce)
Source: TradingEconomics.com, accessed Nov 7 2025.
The constraint is measurable in the data, evident as S&P Global Market Intelligence reports that the average gold head grade fell 13 percent between 2012 and 2022, from 1.31 grams per tonne to 1.14 g/t, while mine stripping ratios rose to 4.24-to-1, meaning more waste must be moved for each unit of ore. That dynamic drives higher fuel use, longer haul cycles, and larger environmental footprints, all factors that increase cost even before new capital is deployed.
For large-cap operators, the arithmetic is tightening. Newmont Corporation (NEM) disclosed a 2024 all-in sustaining cost of $1,516 per ounce, up from $1,444 a year earlier. Industry-wide averages compiled by the World Gold Council place Q3 2024 AISC near $1,456 per ounce.
Margins remain positive but compressed and the consequence is predictable: output is stable, not expanding, even as global demand from investors and central banks continues to build, a supply-side ceiling quietly underwriting today’s elevated price range.
Exploration Investment Is Shrinking Despite Record Prices
Exploration spending is contracting even as bullion trades near record levels. S&P Global Market Intelligence reports that global non-ferrous exploration budgets fell 3 percent in 2023 to $12.76 billion and are projected to decline roughly another 3 percent in 2024 as financing conditions remain weak. Within that total, gold-focused exploration is expected to fall 7 percent to $5.55 billion.
The constraint is financial before it is geological. Junior and intermediate miners raised $11.62 billion in 2023, roughly half the capital mobilized two years earlier. Reported drill activity fell to 53,582 holes, the lowest level in over a decade. Capital that once funded greenfield programs is being redirected toward reserve expansion at existing sites, where returns are more predictable and permitting risk lower.
A Structural Lag in Discovery
The outcome is a thinner project pipeline and even at elevated gold prices, the industry’s discovery rate remains historically low, with few large deposits advancing beyond preliminary studies. S&P Global Market Intelligence reports that in 2024, grassroots exploration’s share of global budgets fell 8 percent to a record low 22 percent of the total nonferrous exploration budget. That imbalance means the reserve base is aging faster than it is being replaced.
This is not a short-term supply gap but a timing problem built into the cycle, and it can take seven to ten years for a new discovery to reach commercial production. Additionally, under current permitting and financing conditions, many projects will never progress that far. The effect is cumulative: each year of underinvestment compounds the scarcity that will define gold’s supply curve well beyond the current price environment.
Recycling and Secondary Supply Are Failing to Fill the Gap
Recycled gold has expanded, but not enough to alter the supply equation. World Gold Council data show that secondary supply rose 11 percent in 2024 to 1,370 tonnes, the highest level since 2012. The increase was driven by short-term price-sensitive selling rather than sustained liquidity. In key markets, households are retaining jewelry and bullion as long-term stores of value despite record nominal prices.
Regional behavior underscores that constraint. In Asia, particularly India, high local prices have subdued jewelry consumption and slowed the normal recycling cycle. Indian demand remained a “lone and tentative bright spot” in Q2 2024, supported by a duty cut and stable macro conditions, but consumers are still adjusting to higher prices. Recycling volumes there softened quarter-on-quarter as households opted to hold metal rather than sell into strength.
In Western markets, investment flows are reviving but without a parallel rise in scrap supply. The WGC reports renewed activity in OTC and ETF gold products, while recycled volumes remain within the upper quartile of historical ranges, showing that high prices have not yet triggered widespread liquidation. Recycling flows remain static, offering little adjustment capacity with regional behavior that tightens available physical supply even when investment sentiment improves.
Central-bank purchases above 1,000 tonnes for the third straight year further tighten circulation, removing metal that might otherwise re-enter trade. The result is structurally secondary supply that expands at the margin, but never quite enough to relieve the scarcity built into gold’s price equilibrium.
ESG and Regulation Are Reshaping the Production Landscape
Environmental, social and governance expectations are now embedded in mine economics and timelines. EY highlights tightening government oversight and rising sustainability requirements as top-tier operational risks, with executives expecting more state control focused on ESG and licensing/permitting (“license to operate”).
In Latin America, regulatory and legal headwinds have extended timelines: Panama’s Supreme Court ruled the Cobre Panamá contract unconstitutional in late-2023, forcing an extended shutdown while authorities weigh next steps in 2025, illustrating how environmental litigation and social opposition can stall output for years.
Permitting delays have also been flagged as a “serious problem” in Chile by industry leaders. In Africa, regulatory approvals can similarly slow development, like how AngloGold Ashanti and Gold Fields paused plans to combine Ghana operations pending government sign-off.
Facing these realities, majors emphasize optimization and brownfields: Agnico Eagle Mines Limited (AEM) is advancing Detour Lake underground and mill optimization, while AngloGold Ashanti Limited (AU) stresses a streamlined, margin-focused portfolio and brownfields programs.
Investor Implications: Supply Tightness Sets a Higher Baseline
With mine supply broadly stagnant and secondary supply only partially responsive, many houses expect gold to remain structurally supported. Without making price claims already used elsewhere in the article, we note that UBS projects robust demand into 2025 to 2026, citing strong central-bank buying (around 900 to 950 tonnes in 2025) and improving investment flows, its Wealth Management CIO has guided to materially higher average prices versus prior cycles.
J.P. Morgan Research similarly carries a constructive view, with published pathways showing higher average prices through late-2025 and into 2026, underpinned by central-bank purchases and renewed ETF interest.
For investors, that backdrop favors vehicles that translate scarcity into exposure: SPDR Gold Shares (GLD) for bullion and VanEck Gold Miners ETF (GDX) for operating leverage to ounces. If bank baselines hold, prices implied by these outlooks are comfortably above $3,800/oz over the medium term, consistent with a market narrative shifting from purely monetary hedging toward physical-scarcity economics.
A Market Underrated for Its Resilience
Gold’s strength in 2025 reflects arithmetic more than sentiment and a decade of slowing mine growth, declining grades, and tightening exploration budgets has created a structural ceiling on new supply. ESG frameworks and regulatory friction now act as a second constraint, extending development timelines and embedding cost into every future ounce.
That combination gives gold its resilience, even as rate expectations shift and investor positioning rotates, the physical imbalance remains and less metal is entering circulation than the market requires. For traders, that imbalance provides a rational floor under price, and for long-term holders, it defines gold’s transition from a reactive hedge to a durable store of value.
The data now tell a simple story: scarcity is what is anchoring this market.
Disclosure: I own some physical silver and gold and the GLD ETF, no other positions in any securities mentioned.