

Bitcoin Price Action and Technical Indicators

Bitcoin printed a lower low near $88,000, with the daily RSI hovering around the oversold boundary at 25. Both the TBO (Trend Bar Oscillator) and On-Balance Volume (OBV) signal strong bearish momentum, reinforced by rising volume as price declines. While a bounce to the daily TBO Fast line remains possible, any relief rally should be treated as a potential bull trap given the prevailing macro bearish trend.
On the weekly chart, a TBO Close Long signal remains “open,” suggesting a theoretical rebound toward $107,000. Historical precedent shows BTC snapping back to the weekly TBO Fast line within a week; however, the required 16% advance above overhead resistance renders this scenario unlikely. The daily TBO Slow line continues its downward trajectory, confirming sustained macro bearish pressure.

Ethereum’s Technical Landscape

Ethereum dipped to $2,873, yet its daily RSI holds up considerably better than Bitcoin’s, indicating the potential for a sharper rebound. Should Bitcoin attempt its TBO Fast line test, ETH may outpace BTC in a recovery move. However, the weekly chart lacks confirmation—historical TBO Close Long signals on ETH did not yield an immediate return to the weekly TBO Fast line, typically requiring 6–9 weeks to materialize.
Stablecoin and Bitcoin Dominance Analysis

Combined stablecoin dominance reached 8.672%, approaching levels last seen in August 2024 and April 2025. A drop into the daily TBO Cloud would signal a shift to bearish consolidation, providing relief for the broader crypto market. Conversely, a breach above 8.75% would confirm deeper bear market conditions, with daily RSI forming a bearish divergence against higher dominance levels.
Bitcoin dominance (BTC.D) rose 0.41% despite BTC’s new low, reflecting dip-buying in BTC relative to alts. BTC.D remains in strong bearish mode, likely targeting TBO support at 57.37%, which historically precedes significant altcoin rallies. Notably, SOL.D and Top10.D are printing TBT bullish divergence clusters, foreshadowing potential strength in leading altcoins.
Traditional Finance and Macro Drivers

The US Dollar Index (DXY) surged back to historic TBO resistance near 100 following Fed meeting comments, exerting pressure on FX pairs like the Japanese Yen. With the Fed pausing rate cuts in December, S&P futures rebounded while the VIX remains in the “Rejection Zone,” indicating elevated market apprehension. In equities, the Nikkei closed above its daily TBO Fast line after a TBO Close Long, whereas Shanghai and Hang Seng continue to struggle, and Gold oscillates around its daily TBO Fast line.
Total Market Cap and Altcoin Cap Dynamics
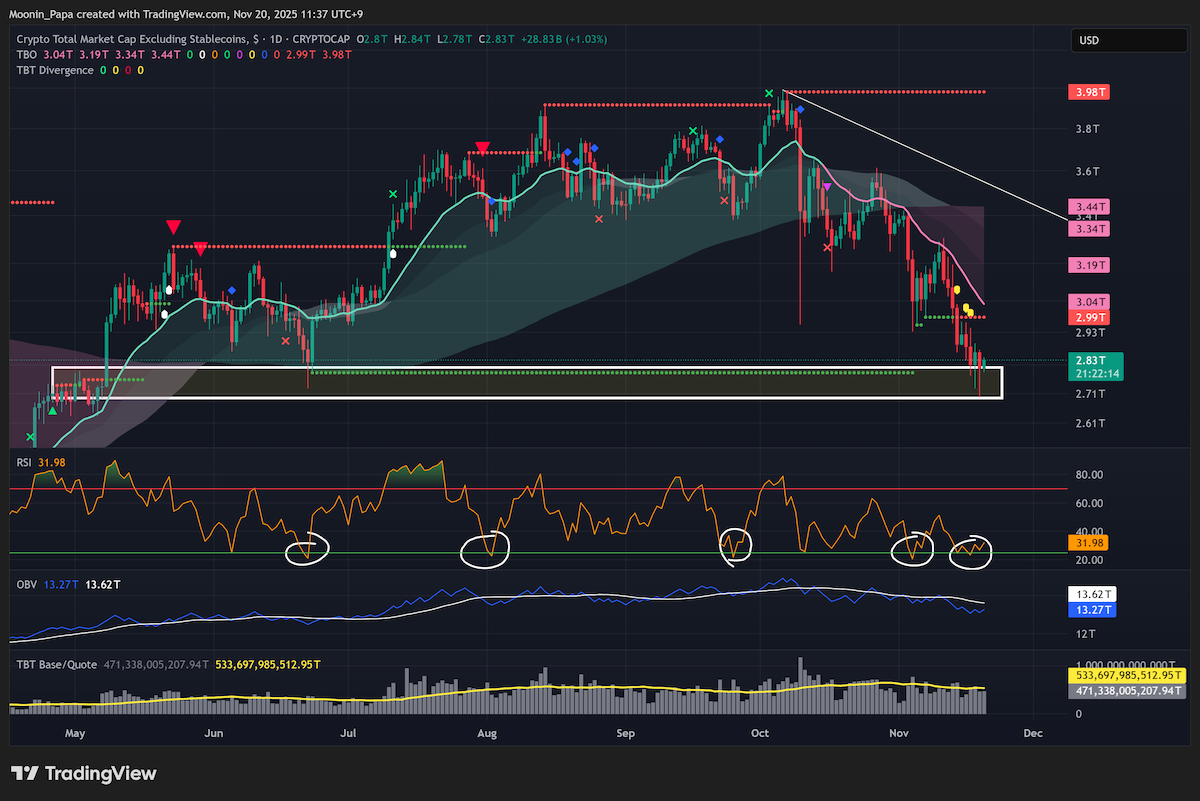
The total crypto market cap excluding stablecoins (TOTALES) remains under bearish pressure but shows “price”-based support and a daily RSI suggesting a rebound is imminent. The OTHERS index sits below its TBO Cloud, yet dominance charts imply rapid reversals are possible if it re-enters the cloud, potentially yielding a TBO Close Short. TOTAL3ESBTC maintains a bullish stance above its compressed daily cloud, targeting TBO resistance for an altcycle peak.
Selected Altcoin Highlights

BNB closed below its daily TBO Cloud, making today’s price action critical for a test of the TBO Fast line and the 1.272 Fib extension. SOL has bounced off historical TBO support but remains within a bearish cloud, presenting profit-taking opportunities near its Fast line. Emerging themes include MNT’s first upward shift in daily TBO support since July, XMR’s bearish divergence prompting caution, and PI showing recovery signs on the 4h chart despite long-term downtrend risk.
Notably, STRK is on its third daily TBO breakout, driven by record volume and social media attention. A reasonable target lies at the 0.618 Fib level near 0.75, with further gains toward the 1.0 level at 2.67 possible but warranting partial profit-taking under current market conditions.
Learn my strategies and the tools I use every day by visiting The Complete Cryptocurrency Investor by Mastering Assets.