
(Kitco Commentary) - As we enter the back half of the fourth quarter of 2025 and begin 2026, the momentum for gold is truly remarkable, with prices surging over 10% in September (best monthly performance since 2016), 5% in October (All-time highs), 4% in November, and nearly 55% this year. This positions gold for the biggest annual gains since 1979, and with the right conditions, we could see $5,000/oz in 2026.

The outlook for gold remains incredibly optimistic. Worldwide, many countries are experiencing declining growth and rising inflation, creating a stagflationary environment that favors gold. When examining specific currencies, it's evident that gold is performing globally and trading near all-time highs against the Australian Dollar, British Pound, Euro, Indian Rupee, and Japanese Yen.
Three key factors are driving continued support for gold prices into 2026, all occurring simultaneously. Central banks are diversifying away from the US dollar and other currencies while increasing their gold reserves, a trend that began in 2022 amid the Russia-Ukraine conflict. Currently, countries hold an average of 20% of their reserves in gold, with China at 8%. The goal is to raise this average to 30%, as central banks seek to hedge against geopolitical and financial risks in the coming years. Staying ahead of the Precious Metals markets has never been easier. Get the Blue Line Futures Precious Metals Chart Pack today by registering here: Get Precious Metals Chart Pack
Gold ETF Holdings
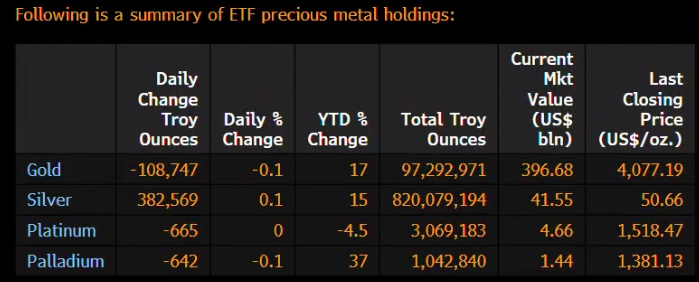
This year has seen a significant 17% increase in gold ETF holdings, reflecting growing investor enthusiasm for gold as a key component in portfolio diversification. Many individuals and institutions are now enhancing the traditional 60/40 portfolio by adding strategic commodities such as gold, silver, copper and crude oil. This shift aims to mitigate risks associated with inflation, currency debasement, and geopolitical uncertainties.
CME FedWatch Tool

Although the timing is uncertain, the direction of interest rates is clear. Restarting the rate cuts in 2026 lays the groundwork for the next leg higher and a tailwind for gold. Once we start getting consistent data releases, that would help lift the fog around the Federal Reserve's path on interest rates and give investors greater clarity on key official economic data, such as jobs and inflation, and shift market focus back to the US fiscal outlook.
Example Trade Idea
As we approach the end of the year and the start of 2026, historical trends indicate a pattern of Seasonal Strength in buying February Gold from late November and selling near the end of January, observed over the past decade. In light of this, we work through an example trade idea of buying February Micro Gold (10 oz), where every $1 move equates to a profit or loss of $10. The target for this trade is $5,000, as breaking through this level could pave the way to reach $10,000 in 2027. The entry point is $4,100, with a stop at $3,900, for a risk of $2,000 and a potential reward of $9,000. Keep in mind that you will need to roll the contract throughout the year, specifically in February, June, and December.
Gold often faces challenges when the dollar strengthens, interest rates increase, and when there is a breakout to the upside for both. This is especially true if the Federal Reserve takes a hawkish stance in response to rising economic activity and inflation, which could lead to higher interest rates. However, we are not currently in such a situation. This is an example of a typical trade idea we propose to our clients at Blue Line Futures. If you have never traded futures or commodities, check out this new educational guide that answers all your questions on transferring your current investing skills into trading "real assets," such as the 10 oz Gold futures contract. You can request yours here: Trade Metals, Transition your Experience Book.