

Bitcoin Technical Overview
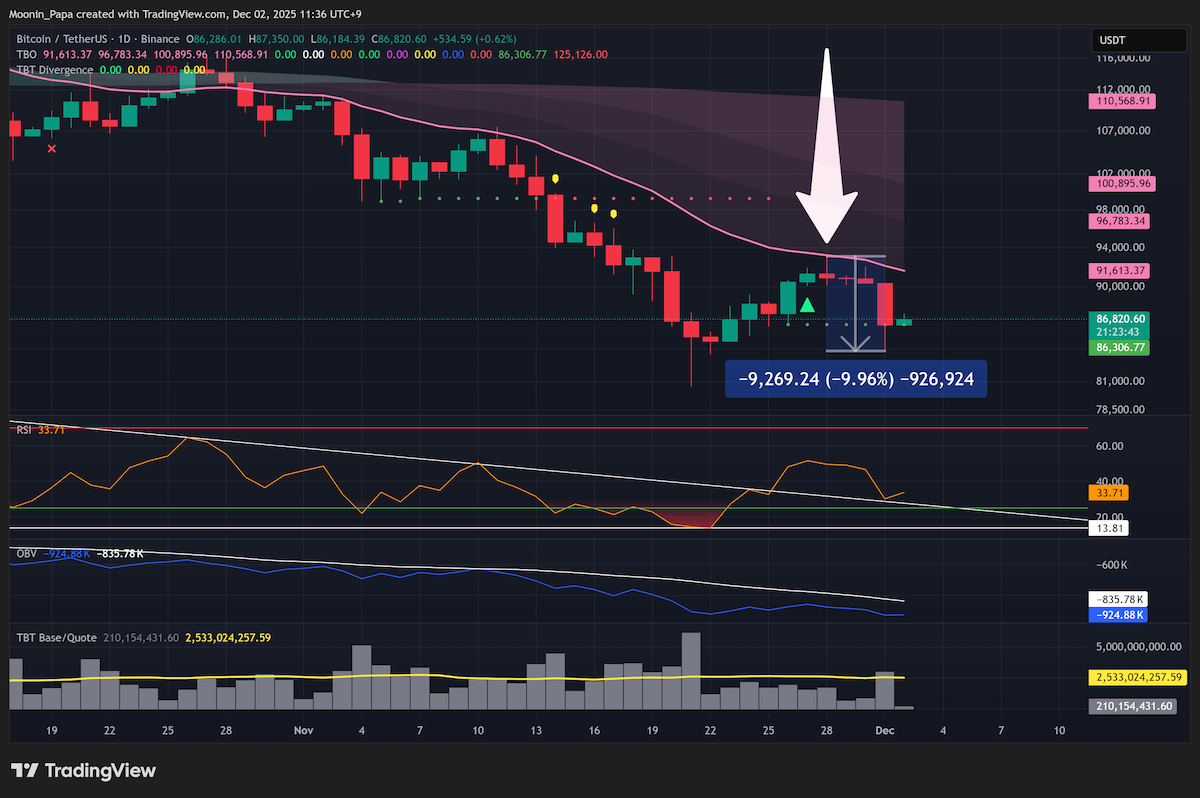
Bitcoin rallied to the daily TBO Fast line near $93,000 before reversing sharply to yesterday’s low of $83,822, providing a prime shorting opportunity. Volume on the decline exceeded the yellow moving average, reinforcing bearish conviction. On the four-hour chart, repeated TBT Bearish Divergences mark each bounce off TBO Support, only to break lower thereafter.
Despite yesterday’s higher low—initiating a potential bear flag formation—Bitcoin remains firmly bearish below the daily TBO Cloud. Bear flags in downtrends often trap longs before support is lost and prices fall sharply. A renewed breakdown below the current support zone would likely trigger the next leg lower.
Ethereum and Stablecoin Dominance Trends
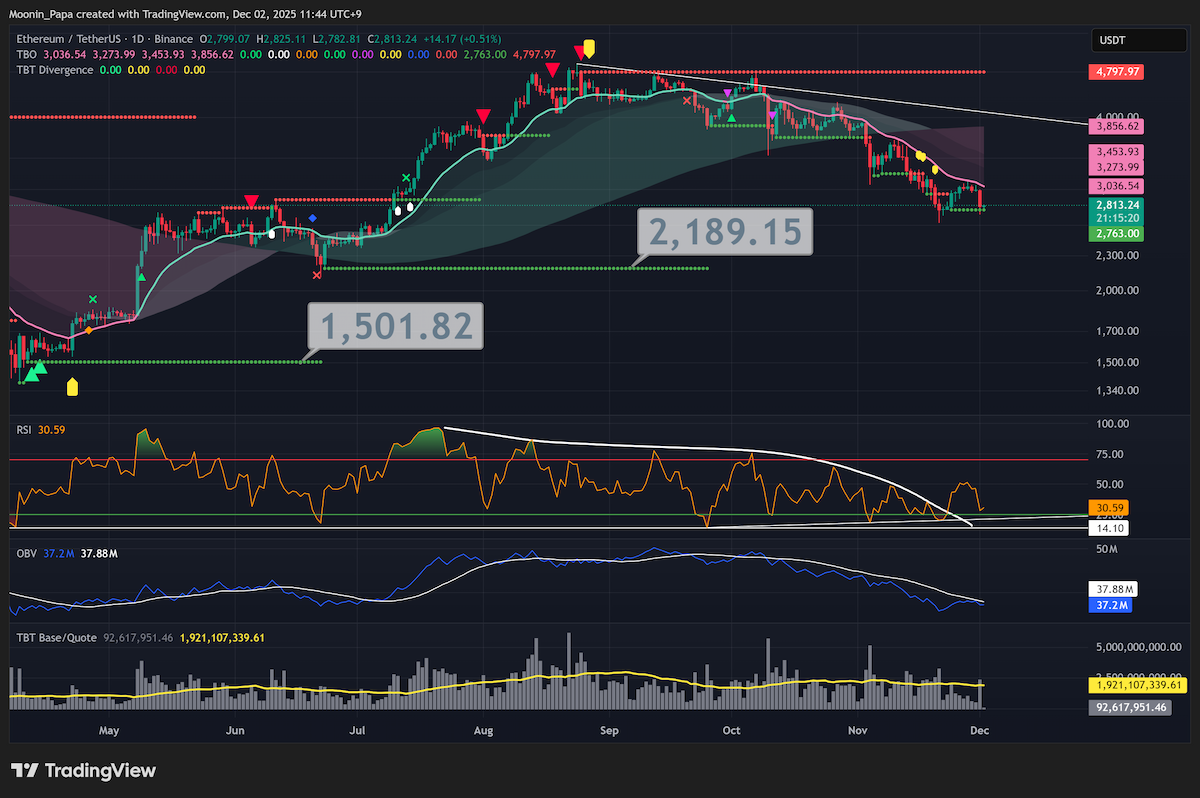
Ethereum mirrored Bitcoin’s higher-low pattern yesterday, now flirting with critical support at historical TBO levels: $2,189 and $1,501. The longer-term target remains near $1,000 by bear-market end. Meanwhile, combined stablecoin dominance spiked to 9.276%, with the TBO Cloud and Slow line signaling strong bullishness and daily RSI breaching overbought territory. However, the absence of a higher local RSI high suggests caution—stablecoin flows could consolidate before reversing.

Bitcoin Dominance and Altcoin Underperformance
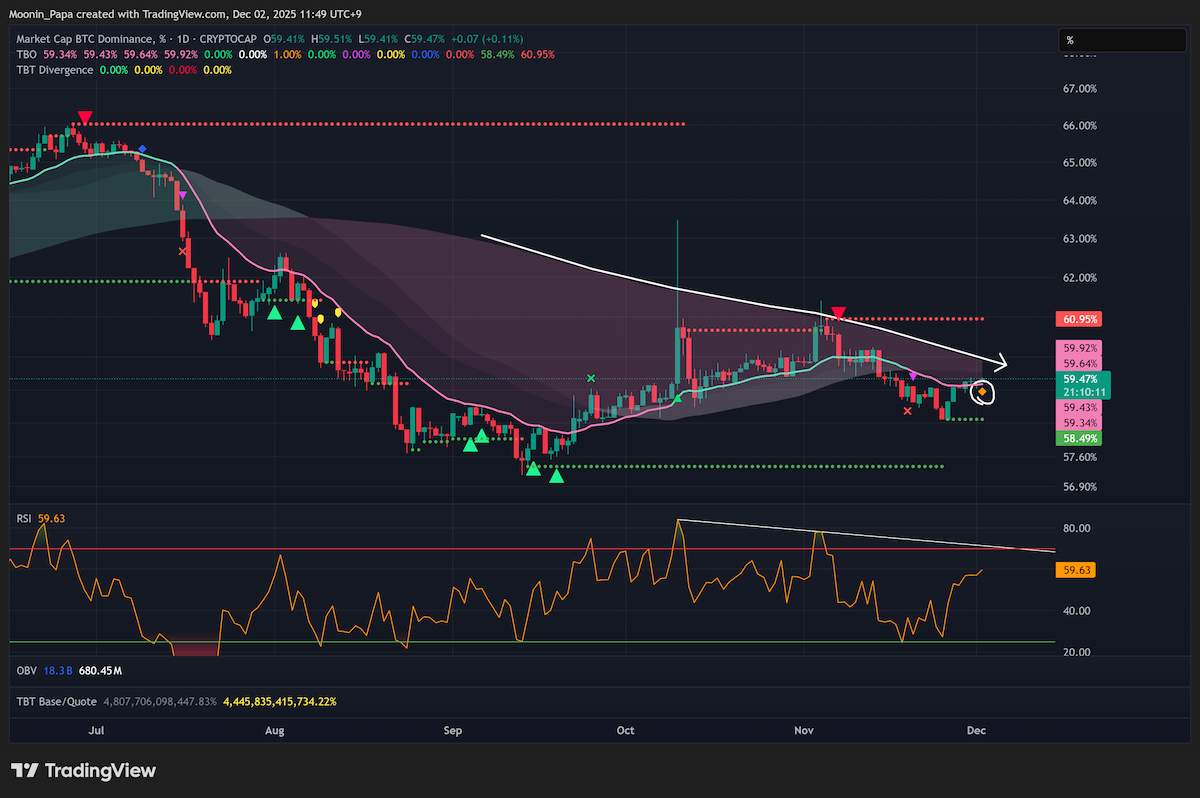
Bitcoin Dominance (BTC.D) is printing a TBO Close Short warning on the daily chart—the first since December 2022—indicating building bullish reversal energy despite a macro bearish slow-line trend. In contrast, OTHERS.D (total altcoins) is oversold on daily RSI, but recent 4-hour TBO Breakdown clusters echo patterns seen on October 5, pointing to further underperformance. TOTAL3ESBTC and OTHERS/BTC display similar breakdowns, suggesting altcoins are likely to lag Bitcoin in the near term.
Traditional Finance and Macro Drivers
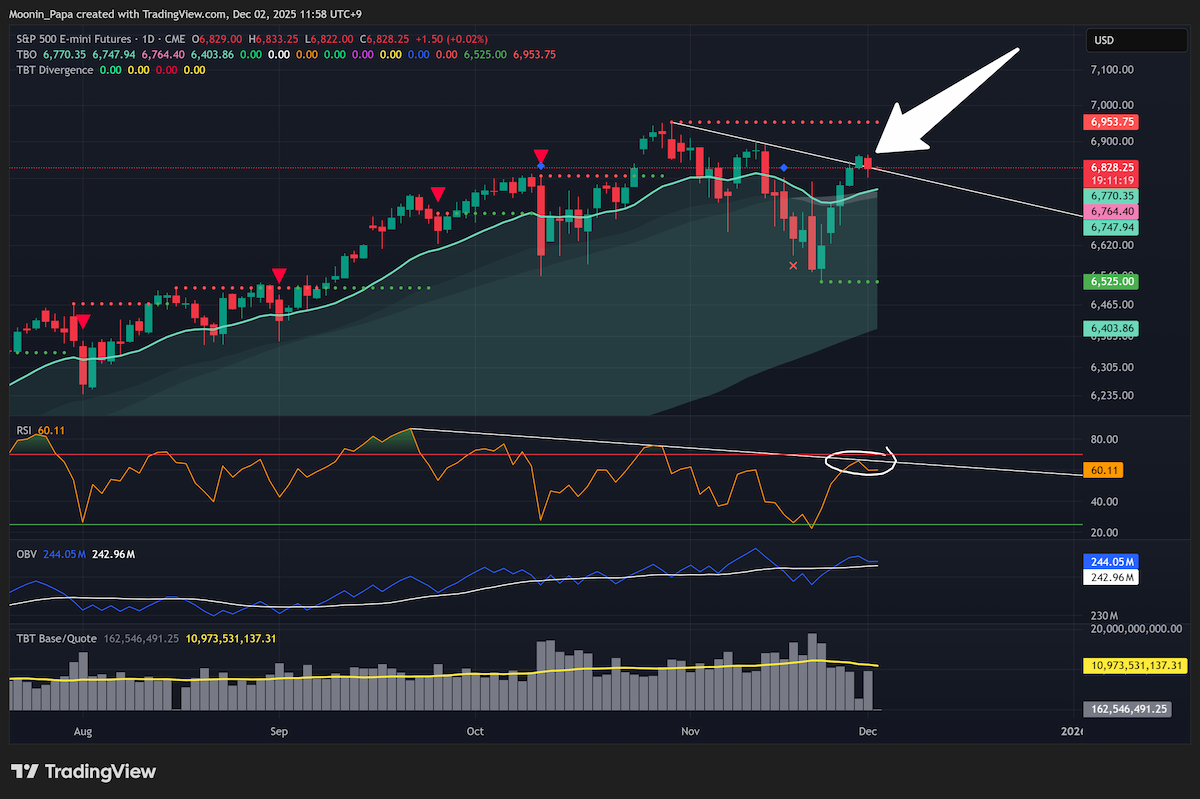
The U.S. Dollar Index slipped into the daily TBO Cloud, confirming a “bearish consolidation” phase, with a downside target around 97. U.S. S&P futures face short-term resistance, while the Dow and Nasdaq appear poised to re-enter their TBO Clouds, signaling renewed consolidation. The VIX closed at 17.23 after a recent TBO Close Long; a repeat of the mid-March spike could foreshadow a sharp S&P sell-off. Internationally, the Nikkei fell 1.89%, surrendering broken support and rejoining its daily TBO Cloud.
Precious Metals Technicals
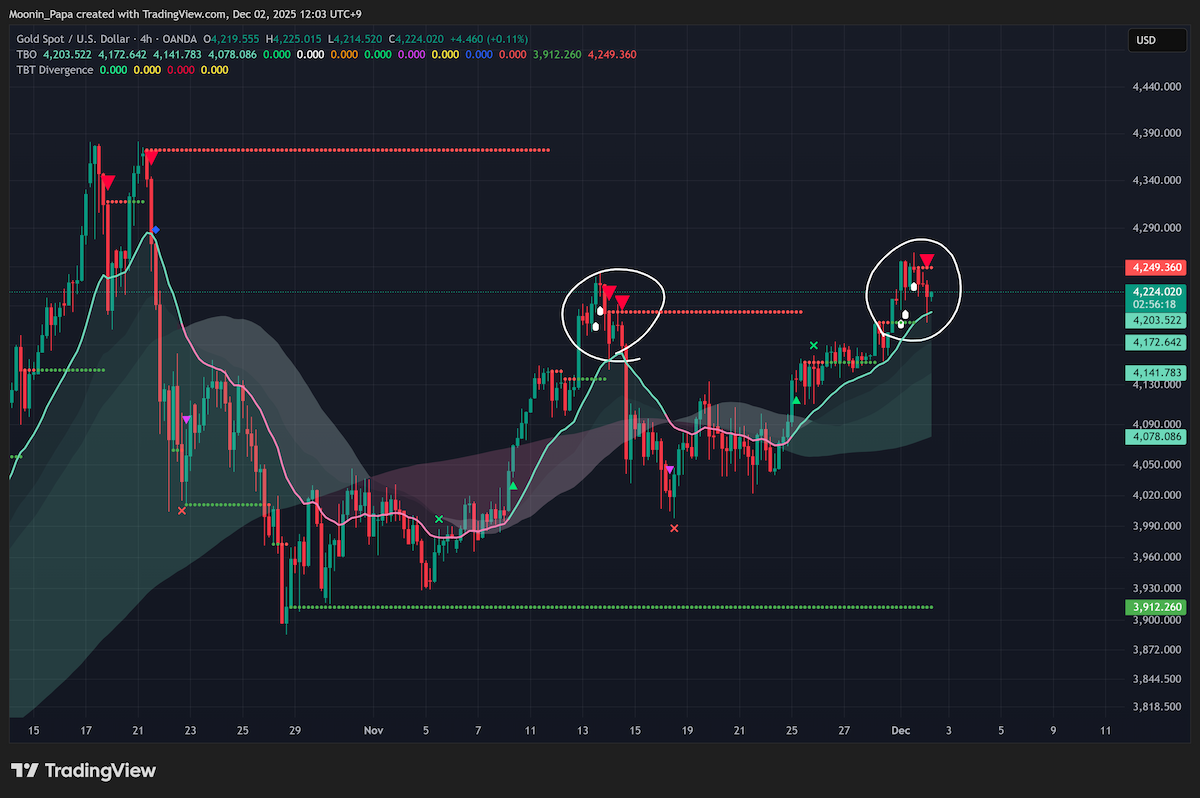
Gold’s four-hour chart shows TBO Breakouts paired with TBT Bearish Divergence, highlighting a likely short-term reversal. Silver’s recent rising-wedge breakout occurred after the rally, suggesting an exhaustion move rather than a sustained uptrend. Traders should watch for failure at key resistance and validate any breakout with volume and momentum confirmation.
Altcoin Strategies and Key Short Positions
BNB may be forming a bump-and-run setup near its 1.272 Fib extension at $992.63, but prevailing bearish momentum casts doubt on a sustained advance. Recent marketwide declines validated last week’s strategy of shorting bounces to daily TBO Fast lines, with four open shorts hitting first targets on yesterday’s pullback. Stops have been moved to entry as positions remain open for further downside.
For those who missed initial bounces, measure the last significant low to recent highs, shave off a few percentage points, and apply this as a short-entry strategy. On SUI, a single 4-hour TBO Breakdown was followed by clusters that led to new lows. ZEC plunged 25% in one day after TBT Bearish Divergences around $700, with a long-term target near $20 and a likely bull-trap tag of the daily TBO Fast line. Non-shorters can seek short-term bounces—for example, 4-hour TBO Support on ASTER or volatility in BCH, MYX, and PI—while adhering strictly to a predefined trading plan.
Learn my strategies and the tools I use every day by visiting The Complete Cryptocurrency Investor by Mastering Assets.