Dec 2, 2025
1. For many years, I’ve noted that Tuesdays are often a soft day for gold, and sometimes there’s a big crash rather than a gentle dip.
2. Having said that, the big picture is what matters most. Click to enlarge this shocking US fiat versus gold chart. The current pause in the action is likely to be something like the one highlighted with the blue circle in 2008; it will be largely insignificant but…

3. Even a modest fiat rally here could be a bit of a shock for over-allocated and unprepared precious metal investors.
4. Click to enlarge this bullish daily chart for gold. Most bank analysts are projecting gold to move up to $4500-$5000 in the coming months and this bull triangle scenario suggests that will occur.

5. Stochastics (14,7,7 series) is overbought, but it was overbought for months as gold surged $1000+ in the previous move up.
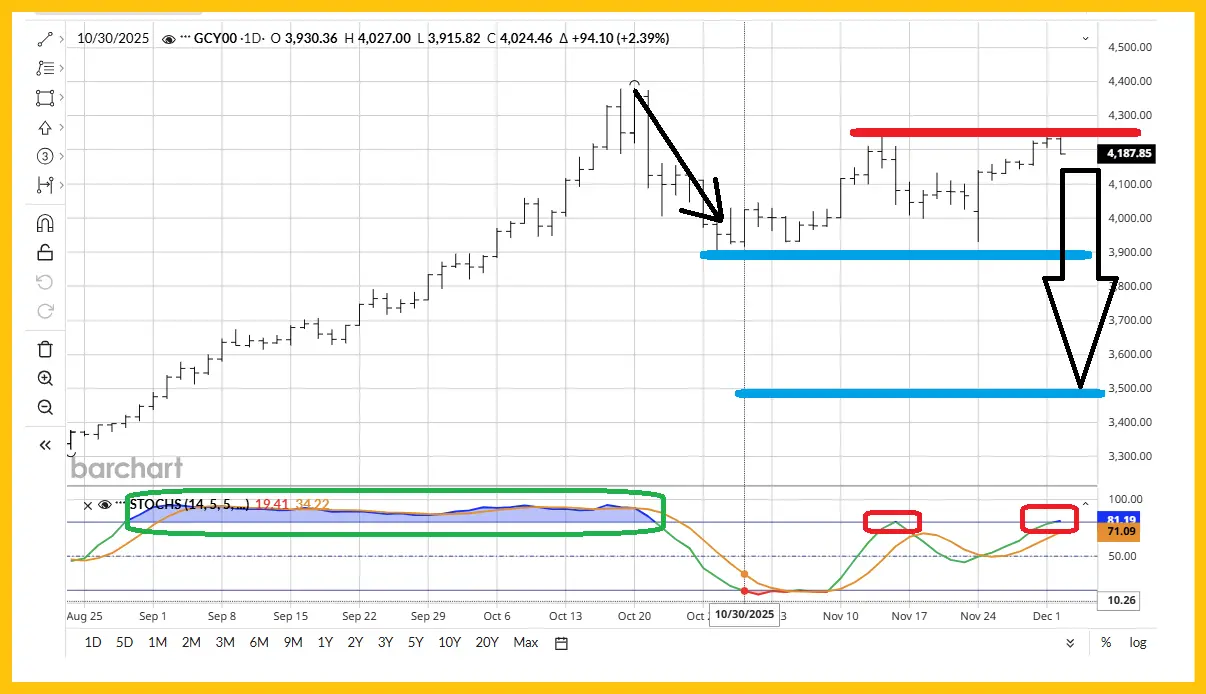
6. In this scenario, there is no triangle. Instead, there’s a decline from the October $4400 area highs into a rectangular continuation pattern.

7. The target of that pattern is $3600, which is just above my massive buy zone of $3500-$3200.
8. For a look at that “buy zone of champions”. Click to enlarge this key weekly chart for gold. Stochastics (14,5,5 series) is impressive, but if the buy signal that’s high in the momentum zone fails, a move down to $3900 or lower is likely.

9. In terms of tactics, please note that amateur investors often try to fix their over-allocation by calling a top.
10. By definition, an over-allocated investor must call a top, or they risk being emotionally hurt in a big way if the market falls unexpectedly… which it eventually does.
11. Clearly, the key to success is reducing the allocation, if need be, down to the comfort point. Investors who can buy gold, silver, and miners at $3500-$3200 gold while maintaining their current allocation are poised for long-term success.
12. Those who could be emotionally hurt (and potentially badly) on a dip to that $3500-$3200 buy zone of champions should consider reducing their allocation right now. The good news:
13. This is a great price zone to book some profits; gold is only about $200 off its $4380 area highs, silver is trading at about $57 (and up about 100% in a year), and GDX is at about $82… close to its $85 area highs!
14. If gold doesn’t dip significantly and instead moves up to the triangle target zone of $4900-$5000, reasonably allocated gold and silver bugs can flash a winning smile there.
15. A move above Monday’s $4265 high would be a nice green shoot for the bulls.
16. Click to enlarge this short-term silver chart. A move above $59 that is accompanied with gold moving above $4265 would be another green shoot. That would destroy the nasty H&S top for silver that has come into play.

17. What about the miners? Click to enlarge this CDNX daily chart. The CDNX is arguably the best proxy for the entire mining stocks sector.

18. Note the fresh buy signal now in play for the key 20,40,9 series MACD indicator at the bottom of the chart.
19.Click to enlarge what some junior mine stock bugs may wish to call the world’s most important chart.This chart is the precious metals and minerals CDNX sub-index and it includes 13 of the world’s most exciting junior miners.

20. Many of them look technically and fundamentally spectacular.
21. Junior mine stock investing isn’t for everyone, especially with size, but as this gargantuan gold bull era rollout continues, these miners look set to outperform everything!
22. Senior mine stock enthusiasts may wish to debate their junior brethren about which chart is the greatest, and this one is certainly a candidate for the greatest of them all.

23. Most senior miners sport costs in the $1500/oz range… while gold trades at about $4200! The undervaluation is obvious, as is the potential upside indicated by the massive inverse H&S pattern and Elliott wave counts on this GDX versus gold chart.24. In a nutshell, it’s not a gold bull market. It’s a bull era that is only in its infancy and likely lasts for 200 years. With their allocation set near-perfectly in sync with their character, the world’s most savvy gold and silver bugs are set for decades of gold stock adventure… and profit!
Thanks!