

Bitcoin Price Action and Technical Levels

The Fed’s confirmation of a 25 bps rate cut for December has paradoxically triggered a sell-off in Bitcoin. Price has slipped below the descending resistance fan line and reentered “strong bearish” territory beneath the daily TBO Cloud. Key support resides at the bear-flag lower boundary near $87 000, with the daily TBO support at $86 000. A decisive break below these levels would signal further downside risk.
On-balance volume and traded volume remain weak, underscoring the absence of buyer conviction. Until a significant uptick in volume confirms a swing low, Bitcoin is likely to continue drifting lower.
Ethereum’s Relative Strength
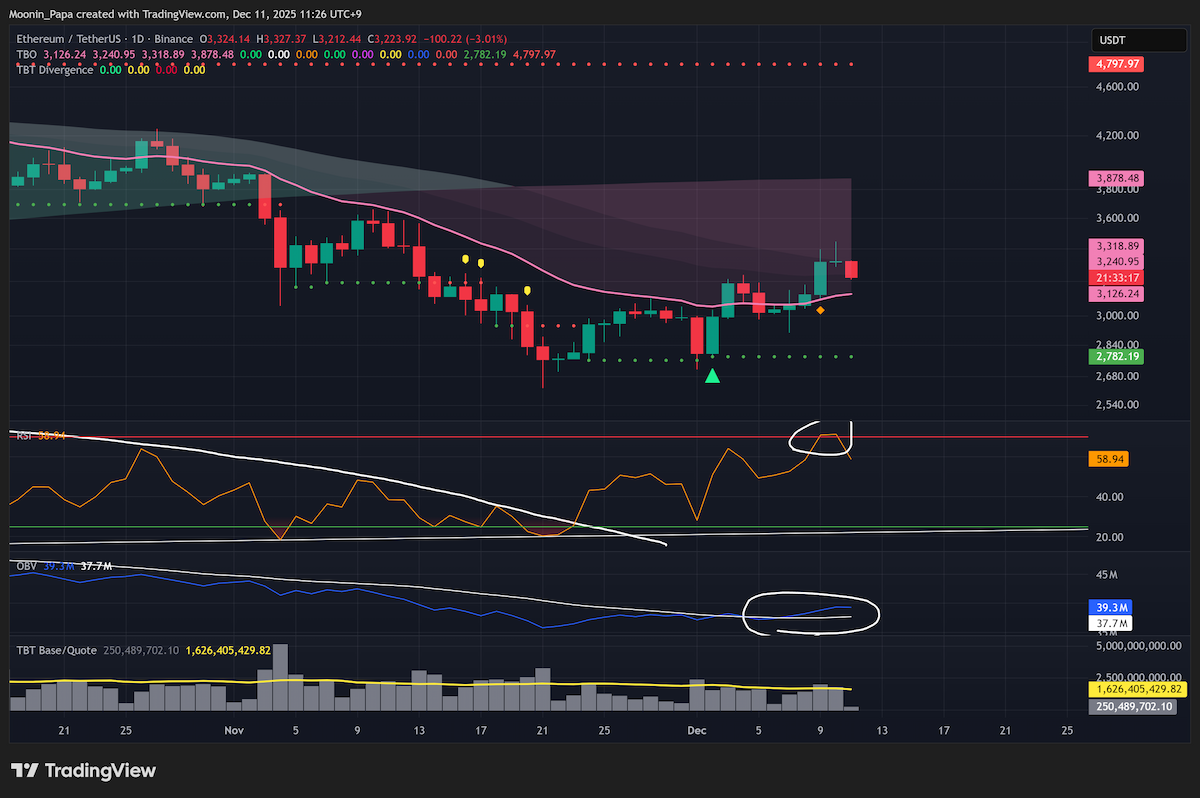
Ethereum’s performance, despite a 3 percent drop, appears more resilient than Bitcoin’s. ETH remains inside the daily TBO Cloud in a “bullish consolidation” mode with a healthy RSI, rising OBV and a curling white moving average line. These indicators suggest a faster rebound for ETH compared to BTC.
The ETH/BTC pair mirrors this strength across key metrics. Notably, TBO resistance that once sat at 0.04163 BTC looks set to shift downward toward 0.03615 BTC—a bullish signal for continued ETH outperformance.

Market Dominance Metrics
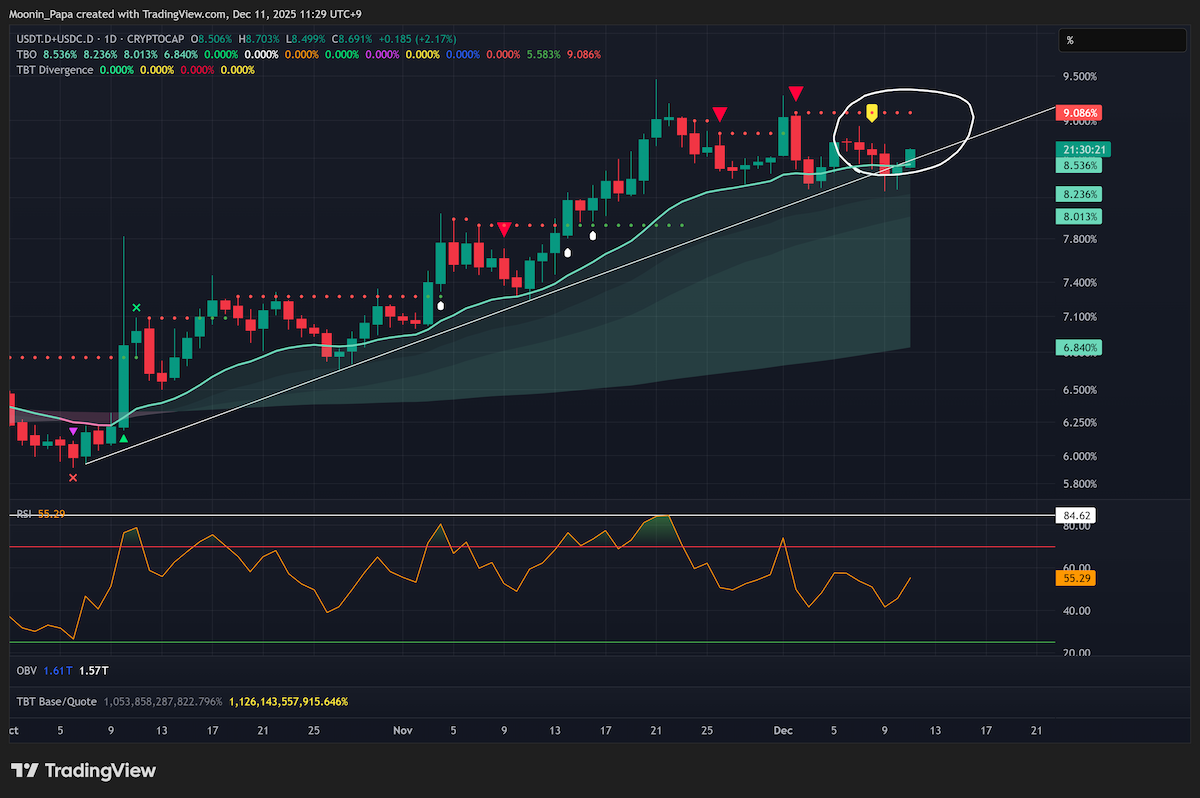
Combined stablecoin dominance is climbing out of its daily TBO Cloud, reflecting temporary weakness in risk assets. Despite a 2 percent rise, the RSI on this chart remains subdued, hinting at a pending reversal that could favor ETH and altcoins.
Bitcoin dominance (BTC.D) remains in “strong bearish” posture below its daily TBO Cloud but has yet to accelerate downside. Conversely, Ethereum dominance (ETH.D) is exhibiting bullish characteristics similar to the ETH/BTC chart, with a target near 14.54 percent should the 12.91 percent low hold. However, a 4-hour TBO Breakdown Cluster in the Top 10 Dominance index warns of potential downside for SOL, BNB, XRP, DOGE, ADA and SHIB. The TOTALES.D index has pulled back, with near-term support around 2.64 trillion.
TradFi and Macro Influences

The Fed’s rate cut decision drove the U.S. Dollar Index (DXY) lower, retracing moves reminiscent of the 2021 pre-rally phase from 90 to 115. In FX markets, the Japanese yen printed a second TBT Bearish Divergence on the daily close, with a potential downside target near 141.
Equities saw a slight uptick in the S&P 500, though no new all-time highs were established. The Nikkei continues to respect overhead resistance amid declining volume. Meanwhile, Gold is retesting its own resistance levels but shows weakening momentum in both price action and traded volume.
Altcoins and Strategic Outlook

Many top-20 altcoins have formed TBT bullish divergences and clusters over recent sessions—early reversal signals that, while promising, lack the conviction of TBO Close Short signals. A short-term altcoin rally is likely within the next week, yet it may prove a classic bull trap.
Traders anticipating this move should identify favorable entry points and employ split profit targets on the way up. Scaling into and out of positions will be crucial to protect portfolios amid continued choppiness and to capitalize on any ensuing recovery rally.
Learn my strategies and the tools I use every day by visiting The Complete Cryptocurrency Investor by Mastering Assets.