Dec 16, 2025
1. The bankrupt US government is going to attempt to release its monthly jobs report today and it may finally be successful.
2. Tuesdays can be a soft day for supreme money gold against inferior fiat… and today is Tuesday. The good news is that gold does often have an interesting tendency to rise aggressively after the release of the jobs report.
3. Click click to enlarge what is likely the world’s most important chart. The never-ending meltdown of US government fiat against gold is one of a myriad of reasons for investors to create a solid gold accumulation plan.

4. Pension regulators in Asia are realising what the citizens there have known for thousands of years; rather than ridiculed and stifled, gold needs to be accumulated and celebrated.

5. In time, the economic rise of 3 billion gold-oriented citizens in China and India will create ongoing demand for gold that dwarfs anything that comes out of America (which itself can be huge in a crisis).
6. This is another key reason for citizens of the world to have a lifetime gold accumulation plan firmly in place.
7. On that key note, I’ll dare to say that supreme money accumulators. Aggressive accumulators can buy at $4250 (just below the current price).The triangle apex at $4100 is another great zone to consider, as is the area near the low of $3900.

8. How likely is it that gold will dip to these fantastic buy zone prices? Well, note the RSI oscillator at the top of the chart. It’s moved back up to the overbought zone from the momentum area at 50.
9. Investors need to be open to a dip when that oscillator becomes overbought. On the price chart itself, there are three clear “skips” up from the $3900 area low. Intermediate trends/waves often feature this type of action.
10. While this has occurred, my key Stochastics oscillator (14,7,7 series) has moved from the buy zone to its selling area.
11. To ice the technical cake, the price has made its way back to the area of the previous double top highs near $4400. In a nutshell, supreme money accumulators need to be ready for action, while cheerleading their existing hoards higher.
12. Most assets can be used as tools to get more gold (and fiat, to a limited degree). To view a truly great tool, click to enlarge this stunning platinum versus fiat chart. I recommended buys on this exciting metal in the base pattern zone. Investors who joined me then may want to book some profits now as the price hits a sell zone at $1800.
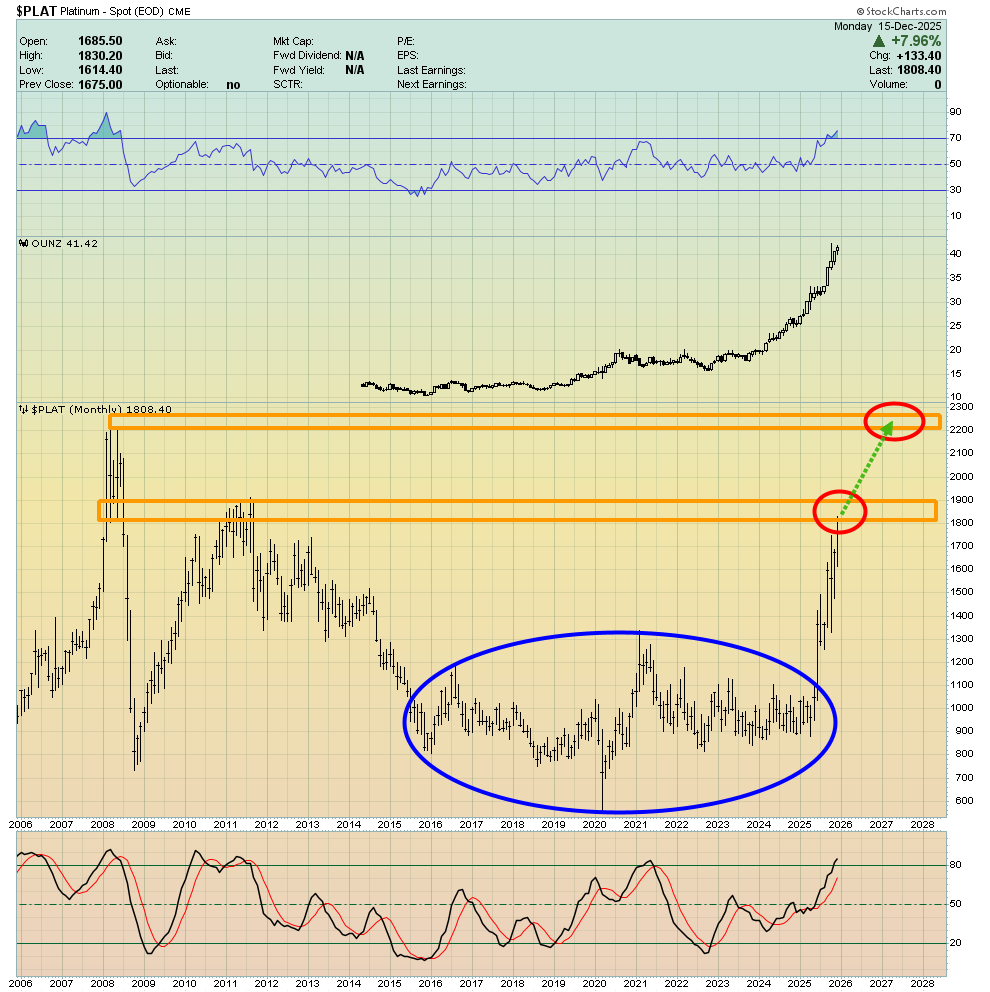
13. How much to sell? Well, platinum is a great metal, but it’s not money, so some has to be sold… with the proceeds earmarked for gold itself.
14. Investors could sell 30% now, 30% at $2200 and hold the rest as a bull era core. Also, the metals are often strongest in the first few months of the next year and so…
15. In 2026 it’s possible and arguably probable that platinum goes to well above $2200 and perhaps to as high as $3000 an ounce.
16. What about the miners? Should copper stocks be part of a gold bug’s total portfolio? For some key technical insight into the matter. Double-click to enlarge this enticing COPX copper stocks ETF chart. It’s a weekly chart and there’s a magnificent bull flag/pennant in play.

17. That pattern targets the $86 area at a bare minimum, and the round number zone of $100 could also be “tagged” before there’s a significant pause.
18. Copper is oil 2.0, but much more importantly, it’s a fabulous tool that investors can use to get more gold. Grub stakers can buy right now, and be ready to get more on dips.
19. Click to enlarge this incredible CDNX weekly chart. Even if there is a dip in the price of gold and silver, I expect to see dozens of CDNX component stocks shooting to new and record highs!
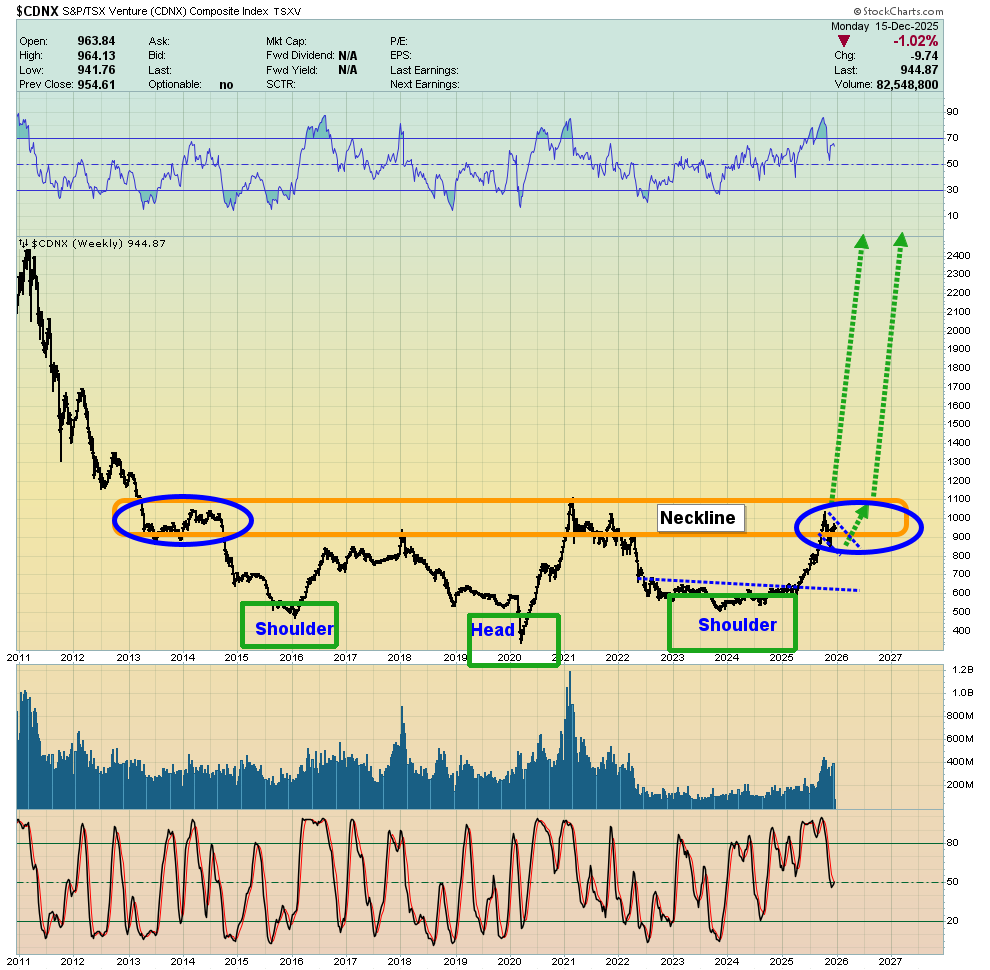
20. The current pause is adding needed symmetry to the base pattern, and when the breakout occurs, a huge crop of ten baggers is likely to make headlines.
21. Click to enlarge another stunning chart, GDX versus gold. A decade-long inverse H&S pattern is in play and now the price of GDX is at the neckline, poised for an explosive upside breakout.

22. In the early 1980s, gold stocks surged while gold fell but the move was brief.
23. Whether gold now rises or falls in the short/medium term is irrelevant to what lies ahead for GDX and most of its component stocks, which is decades of outperformance against gold.
24. I’ll leave it to individual investors to decide whether the CDNX chart or this GDX chart is the greatest in the history of markets, but I’m calling it a golden bull era tie!
Thanks!