
(Kitco News) - Gold and silver prices are sharply lower and near daily lows in midday U.S. trading Thursday. A rally in the U.S. dollar index and a hawkish Federal Reserve are trumping tame U.S. inflation reports late this week. August gold was last down $39.70 at $2,315.40. July silver hit a five-week low and was last down $1.322 at $28.945.
Technical selling was also featured in gold and silver markets today as the near-term chart postures for both metals have turned more bearish recently.
Today’s U.S. producer price index report for May came in at down 0.2%, month-on-month, versus market expectations for up 0.1% and compares to the April report’s rise of 0.5%. The core PPI in May (minus food and energy) came in at unchanged versus up 0.3% expected, month-on-month, and compares to a rise of 0.5% in the April report. The tame PPI report today followed a tamer consumer price index report on Wednesday.
However, the Federal Reserve Wednesday delivered a surprisingly hawkish outlook. The FOMC members revised U.S. rate-cut expectations to one cut from three cuts that were expected in March. Updated Fed projections also included upward revisions to U.S. inflation in 2024 and 2025 to 2.6% (2.4% in March) and 2.3% (2.2% in March), respectively. The Fed did hold its monetary policy steady at this week’s meeting. Fed Chairman Jerome Powell at his press conference said the latest inflation numbers lower than expected but may not have been fully reflecting the latest quarterly Fed projections. The hawkish Fed has helped to boost the U.S. dollar index late this week. However, U.S. Treasury yields Thursday did dip just a bit, suggesting bond traders think the Fed will still cut interest rates later this year.
The other key outside market today sees Nymex crude oil prices near steady and trading around $78.50 a barrel. The benchmark 10-year U.S. Treasury note yield is presently around 4.25%.
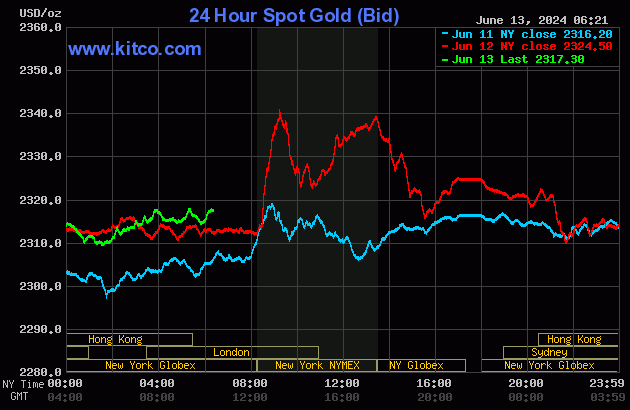
Technically, August gold bulls have quickly lost their slight overall near-term technical advantage. A bear flag or bearish pennant pattern has formed on the daily bar chart. Bulls’ next upside price objective is to produce a close above solid resistance at last week’s high of $2,406.70. Bears' next near-term downside price objective is pushing futures prices below solid technical support at $2,250.00. First resistance is seen at today’s high of $2,342.40 and then at this week’s high of $2,358.80. First support is seen at the June low of $2,304.20 and then at $2,300.00. Wyckoff's Market Rating: 5.0.
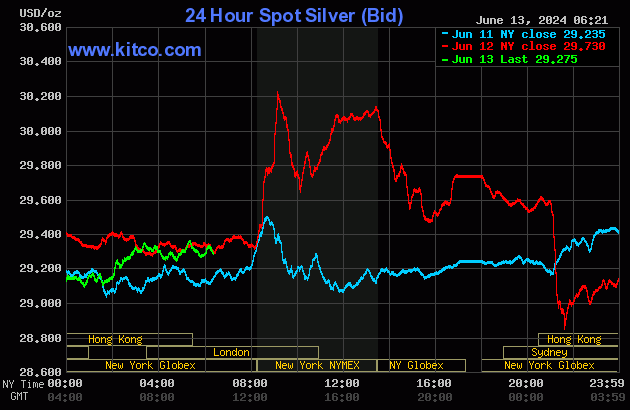
July silver futures bulls have also lost their overall near-term technical advantage. Prices are trending down on the daily bar chart. Silver bulls' next upside price objective is closing prices above solid technical resistance at $31.00. The next downside price objective for the bears is closing prices below solid support at $27.50. First resistance is seen at today’s high of $29.83 and then at $30.00. Next support is seen at today’s low of $28.73 and then at $28.50. Wyckoff's Market Rating: 5.0.
(Hey! My “Markets Front Burner” weekly email report is my best writing and analysis, I think, because I get to look ahead at the marketplace and do some market price forecasting. Plus, I’ll throw in an educational feature to move you up the ladder of trading/investing success. And it’s free! Email me at jim@jimwyckoff.com and I’ll add your email address to my Front Burner list.)